Explore the latest market insights from the Global Research Department at the Trading Center. Discover new trading methods and opportunities among popular trading products.
EUR/USD GBP/USD Spot Gold EUR/JPY EUR/GBP USD/CHF German DAX Index Futures (Eurex) Brent Crude (ICE) UK FTSE 100 Index Futures
Note: Due to market fluctuations, prices may have moved beyond key points, rendering strategies ineffective.
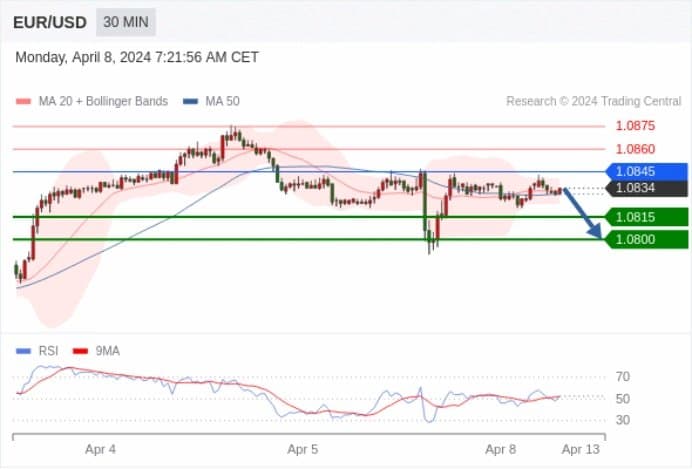
EUR/USD Intraday: Proceed with caution.
Pivot Point:
1.0845
Trading Strategy:
Below 1.0845, bearish with target levels at 1.0815, then 1.0800.
Alternative Strategy:
Above 1.0845, bullish with target levels set at 1.0860, then 1.0875.
Technical Commentary:
Intraday technical indicators are complex, proceed with caution.
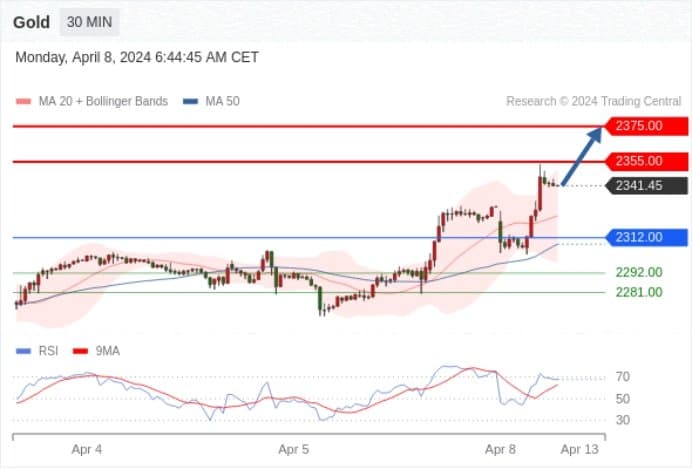
Spot Gold Intraday: Further increase expected.
Pivot Point:
2312.00
Trading Strategy:
Above 2312.00, bullish with target levels at 2355.00, then 2375.00.
Alternative Strategy:
Below 2312.00, bearish, target levels set at 2292.00, then 2281.00.
Technical Commentary:
The RSI indicator shows a further upward trend.
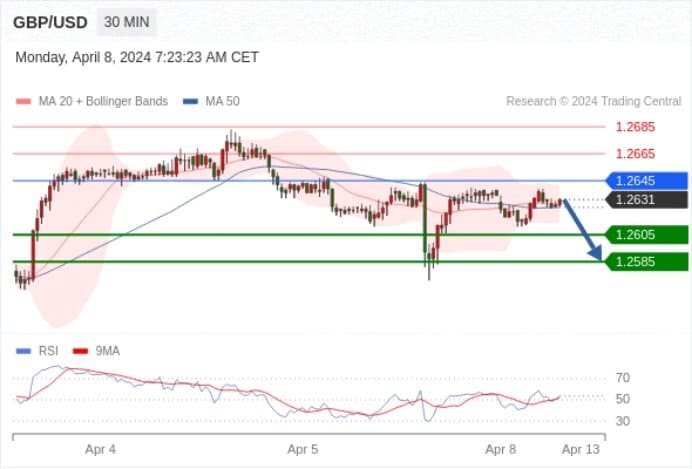
GBP/USD Intraday: Proceed with caution.
Pivot Point:
1.2645
Trading Strategy:
Below 1.2645, bearish, target levels at 1.2605, then 1.2585.
Alternative Strategy:
Above 1.2645, bullish with target levels set at 1.2665, then 1.2685.
Technical Commentary:
Intraday technical indicators are complex, proceed with caution.
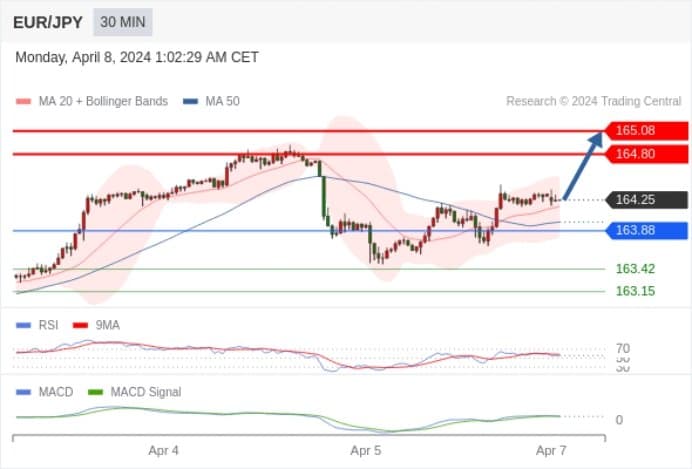
EUR/JPY Intraday: Bullish, with 163.88 as the support level, target set at 165.08.
Pivot Point is:
163.88
Trading Strategy:
Bullish, with 163.88 as the support level, target set at 165.08.
Alternative Strategy:
If it breaks below 163.88, EUR/JPY target directed to 163.42 and 163.15.
Technical Commentary:
The RSI indicator is above the neutral zone of 50. The MACD indicator is bullish and is below its signal line. In addition, prices are above their 20-day and 50-day moving averages (which are at 164.18 and 163.99, respectively).
EUR/GBP Intraday: Bullish, as long as 0.8570 is not breached.
Pivot Point is:
0.8570
Trading Strategy:
Bullish, as long as 0.8570 is not breached.
Alternative Strategy:
If it drops below 0.8570, EUR/GBP target directed to 0.8560 and 0.8553.
Technical Commentary:
The RSI indicator is above the neutral zone of 50. The MACD indicator shows a bearish state and is above its signal line. In addition, prices are above their 20-day and 50-day moving averages (currently at 0.8577 and 0.8576, respectively).

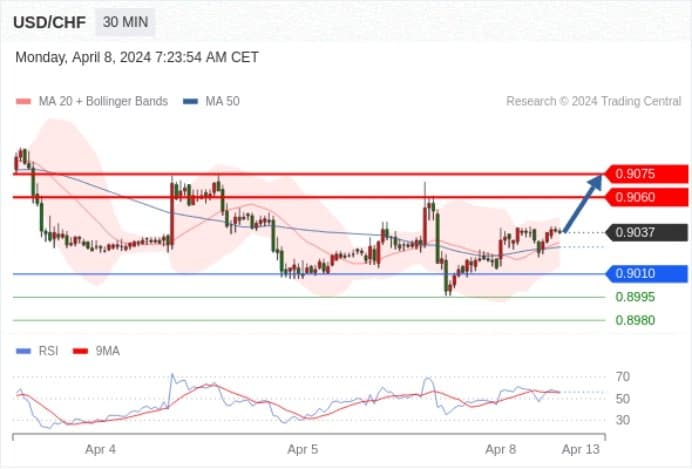
USD/CHF Intraday: Bullish above 0.9010.
Pivot Point:
0.9010
Trading Strategy:
Above 0.9010, bullish, target levels at 0.9060, then 0.9075.
Alternative Strategy:
Below 0.9010, bearish, target levels set at 0.8995, then 0.8980.
Technical Commentary:
A base near 0.9010 has formed, providing short-term stability in the trend.
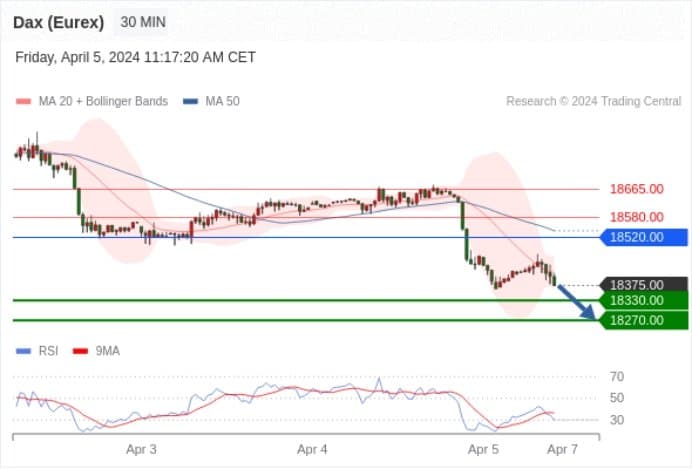
German DAX Index Futures (Eurex) Intraday: Downtrend.
Pivot Point:
18520.00
Trading Strategy:
Below 18520.00, bearish, target levels at 18330.00, then 18270.00.
Alternative Strategy:
Above 18520.00, bullish, target levels set at 18580.00, then 18665.00.
Technical Commentary:
The RSI indicator is bearish, with more room to decline.
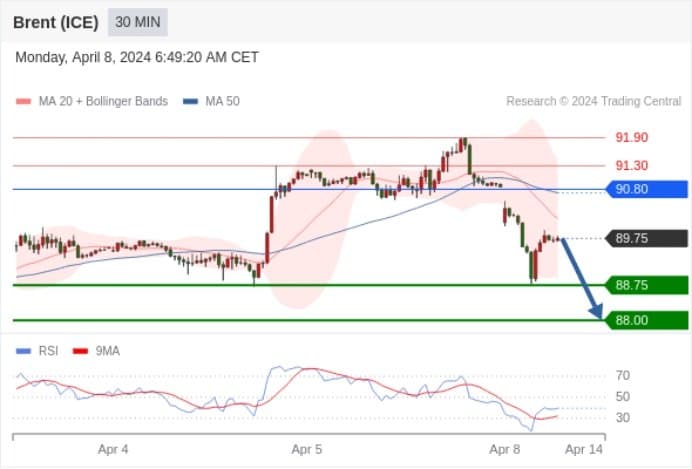
Brent Crude (ICE) Intraday: Target set at 88.00.
Pivot Point:
90.80
Trading Strategy:
Below 90.80, bearish, target levels at 88.75, then 88.00.
Alternative Strategy:
Above 90.80, bullish, target levels set at 91.30, then 91.90.
Technical Commentary:
As long as the 90.80 resistance is not breached, the risk of breaking lower than 88.75 is high.
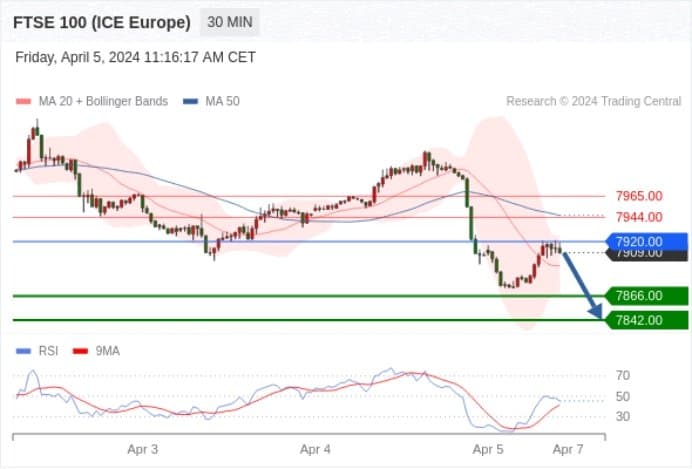
UK FTSE 100 Index Futures Intraday: Short-term key resistance at 7920.00.
Pivot Point:
7920.00
Trading Strategy:
Below 7920.00, bearish, target levels at 7866.00, then 7842.00.
Alternative Strategy:
Above 7920.00, bullish, target levels set at 7944.00, then 7965.00.
Technical Commentary:
At this stage, the index faces the challenge of the 7920.00 resistance area.