FxPro: Daily Technical Analysis Before the European Market Opens on March 12, 2024
Explore today's market insights from the global research department at the trading center. Discover new trading methods and opportunities from popular trading products.
EUR/USD GBP/USD Gold Spot EUR/JPY EUR/GBP USD/CHF German DAX Index Futures (Eurex) Brent Crude (ICE) UK FTSE 100 Index Futures
Note: Due to market volatility, prices may have moved past key levels, rendering strategies invalid.
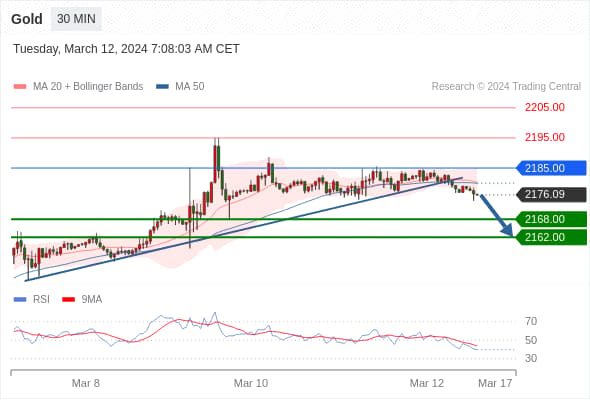
Gold Spot Current: Adjustment.
Pivot Point:
2185.00
Trading Strategy:
Below 2185.00, bearish with a target price of 2168.00, followed by 2162.00.
Alternative Strategy:
Above 2185.00, bullish with target prices of 2195.00, followed by 2205.00.
Technical Commentary:
Bearish according to the RSI indicator.
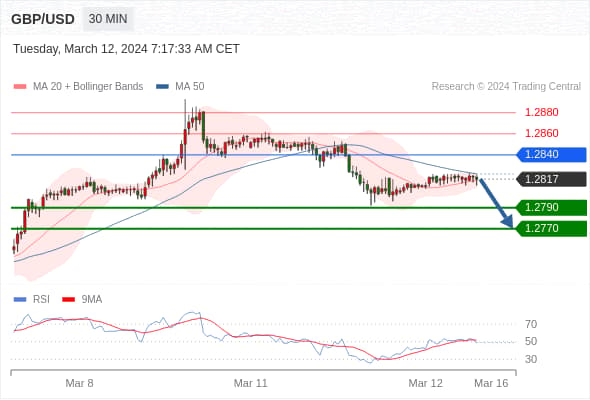
GBP/USD Today: Short-term key resistance at 1.2840.
Pivot Point:
1.2840
Trading Strategy:
Below 1.2840, bearish with a target price of 1.2790, followed by 1.2770.
Alternative Strategy:
Above 1.2840, bullish with target prices of 1.2860, followed by 1.2880.
Technical Commentary:
As long as 1.2840 resistance is not breached, the risk of a decline breaking below 1.2790 is high.
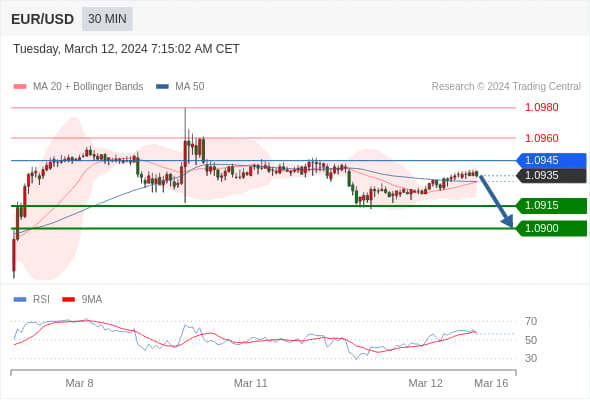
EUR/USD Today: Short-term key resistance at 1.0945.
Pivot Point:
1.0945
Trading Strategy:
Below 1.0945, bearish with a target price of 1.0915, followed by 1.0900.
Alternative Strategy:
Above 1.0945, bullish with target prices of 1.0960, followed by 1.0980.
Technical Commentary:
The upward room could be limited by the 1.0945 resistance.
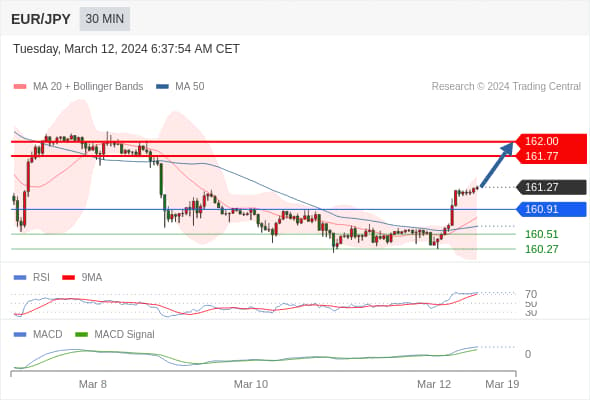
EUR/JPY Today: Bullish, with 160.91 as the support level.
Pivot Point is:
160.91
Trading Strategy:
Bullish, with 160.91 as the support level.
Alternative Strategy:
If it falls below 160.91, EUR/JPY's target direction is set at 160.51 and 160.27.
Technical Commentary:
The RSI indicator above 70 suggests an ongoing upward trend or an overbought condition, necessitating a technical adjustment. By comparing the RSI indicator and price trends, we can observe whether there's a divergence between them. The MACD indicator is above its signal line, bullish. Additionally, the price is above its 20-day and 50-day moving averages (located at 160.78 and 160.64, respectively).
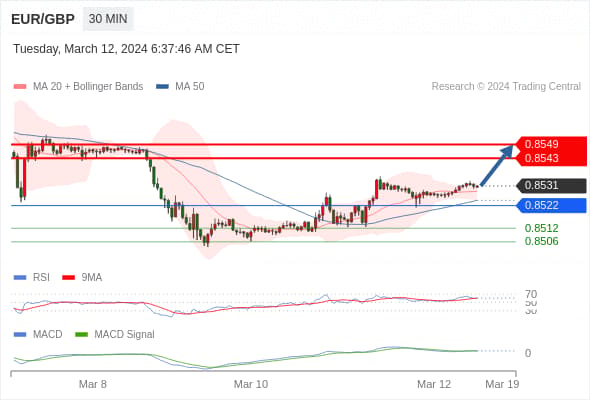
EUR/GBP Today: Bullish, with 0.8522 as the support level.
0.8522 as the pivot point.
Trading Strategy:
Bullish, with 0.8522 as the support level.
Alternative Strategy:
Falling below 0.8522 would indicate a continuing downward trend, with target levels at 0.8512 followed by 0.8506.
Technical Commentary:
The RSI indicator is above the neutral zone of 50. The MACD indicator is above its signal line, bullish. Moreover, the price is above its 20-day and 50-day moving averages (currently at 0.8528 and 0.8524, respectively).
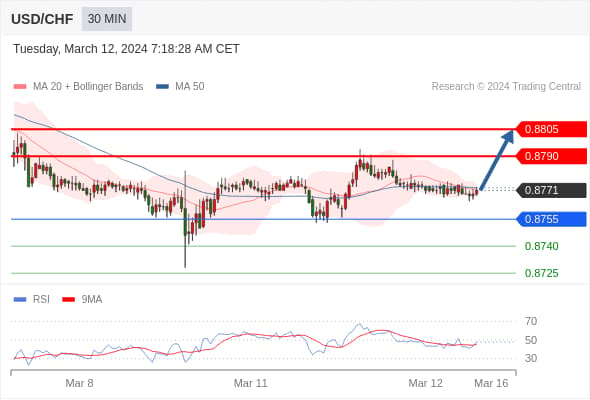
USD/CHF Today: Bullish, above 0.8755.
Pivot Point:
0.8755
Trading Strategy:
Above 0.8755, bullish with target prices of 0.8790, followed by 0.8805.
Alternative Strategy:
Below 0.8755, bearish with target prices set at 0.8740, followed by 0.8725.
Technical Commentary:
The RSI indicator is trending upward.
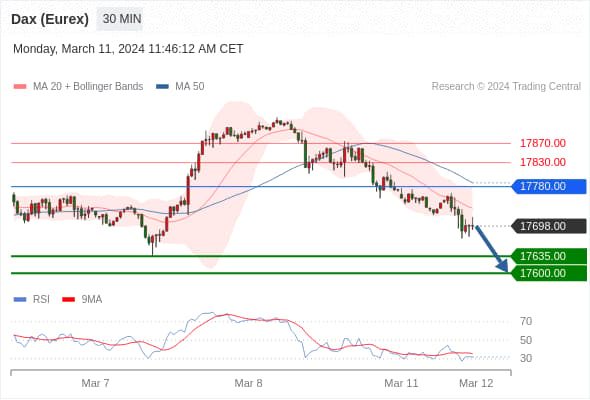
German DAX Index Futures (Eurex) (H4) Today: Downward Trend.
Pivot Point:
17780.00
Trading Strategy:
Below 17780.00, bearish with target prices of 17635.00, followed by 17600.00.
Alternative Strategy:
Above 17780.00, bullish with target prices set at 17830.00, followed by 17870.00.
Technical Commentary:
The RSI indicator is below the 50% neutral zone.
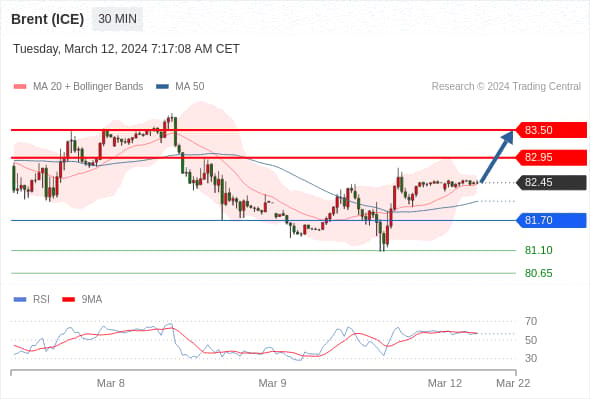
Brent Crude (ICE) (K4) Today: Expected to Rise.
Pivot Point:
81.70
Trading Strategy:
Above 81.70, bullish with target prices of 82.95, followed by 83.50.
Alternative Strategy:
Below 81.70, bearish with target prices set at 81.10, followed by 80.65.
Technical Commentary:
The RSI indicator is on an upward trend.
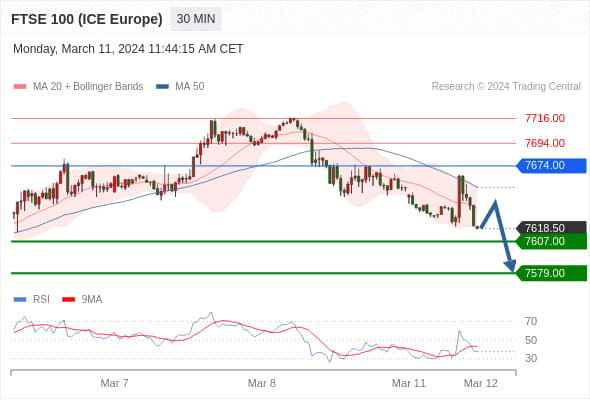
UK FTSE 100 Index Futures Today: Downward Trend.
Pivot Point:
7674.00
Trading Strategy:
Below 7674.00, bearish with target prices of 7607.00, followed by 7579.00.
Alternative Strategy:
Above 7674.00, bullish with target prices set at 7694.00, followed by 7716.00.
Technical Commentary:
The RSI indicator is showing a new downward trend.