See the market view of the Global Research Department at the trade center today. Explore new trading methods and opportunities from popular trading products.
Euro/US Dollar British Pound/US Dollar Spot Gold Euro/Japanese Yen Euro/British Pound US Dollar/Swiss Franc Germany DAX Index Futures (Eurex) Brent Crude (ICE) UK FTSE 100 Index Futures
Warm reminder: Due to market fluctuations, prices may have passed the key point, making the strategy invalid.
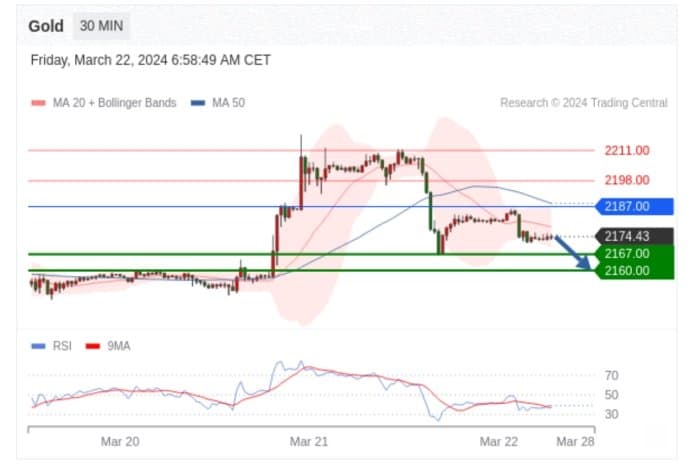
Spot Gold Within the day: Short-term key resistance is at 2187.00.
Pivot Point:
2187.00
Trading Strategy:
Below 2187.00, bearish, with target prices at 2167.00, and then 2160.00.
Alternative Strategy:
Above 2187.00, bullish, with target prices at 2198.00, and then 2211.00.
Technical Commentary:
The RSI technical indicator is below the 50% neutral area.
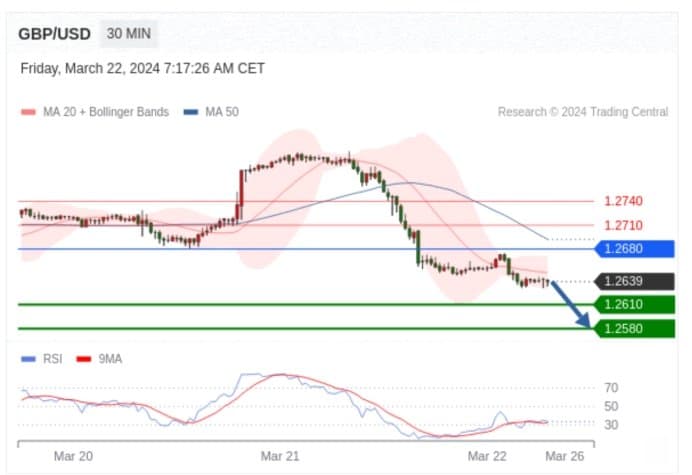
British Pound/US Dollar Within the day: Downtrend.
Pivot Point:
1.2680
Trading Strategy:
Below 1.2680, bearish, with target prices at 1.2610, and then 1.2580.
Alternative Strategy:
Above 1.2680, bullish, with target prices at 1.2710, and then 1.2740.
Technical Commentary:
The RSI technical indicator has a complex trend, leaning towards a decline.
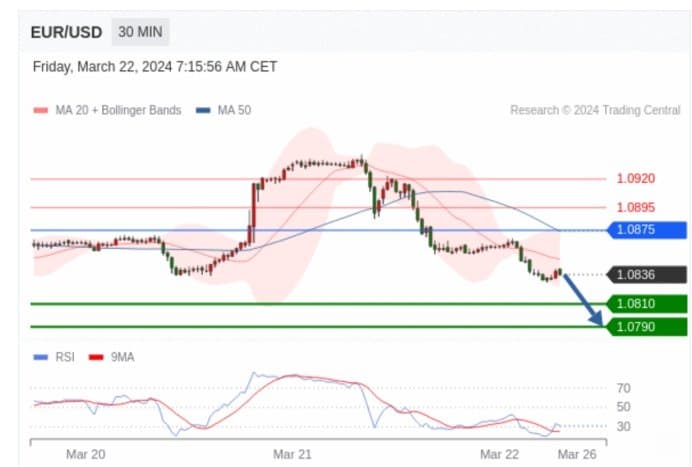
Euro/US Dollar Within the day: Downtrend.
Pivot Point:
1.0875
Trading Strategy:
Below 1.0875, bearish, with target prices at 1.0810, and then 1.0790.
Alternative Strategy:
Above 1.0875, bullish, with target prices at 1.0895, and then 1.0920.
Technical Commentary:
The RSI technical indicator is trending downwards.
Euro/Japanese Yen Within the day: Bearish, below 164.57.
Pivot Point:
164.57
Trading Strategy:
Bearish, below 164.57.
Alternative Strategy:
If breaking above 164.57, EUR/JPY targets 164.97 and 165.22.
Technical Commentary:
The RSI indicato