Explore new trading methods and opportunities from popular trading products in the daily market view of the Global Research Department of the trading center.
EUR/USD GBP/USD Spot Gold EUR/JPY EUR/GBP USD/CHF Germany DAX Index Futures (Eurex) Brent Crude (ICE) FTSE 100 Index Futures
Friendly reminder: Due to market fluctuations, prices may have passed key points, rendering strategies ineffective.
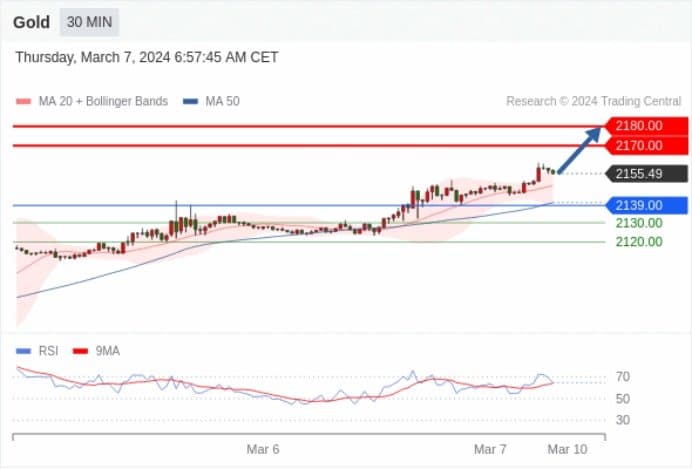
Spot Gold Within the day: Further rise.
Pivot point:
2139.00
Trading strategy:
Above 2139.00, bullish with target prices at 2170.00, followed by 2180.00.
Alternative strategy:
Below 2139.00, bearish with target prices set at 2130.00, followed by 2120.00.
Technical commentary:
Its immediate trend maintains upward, with strong momentum.
![4b9bcd6c-74ff-4763-9f2b-dc3d5474693c](https://production-app-asset.traderknows.com/images/079326f06e4f460e8678204d52065ac7.width-800.jpg?Expires=1724593952&Signature=0vNx40Wmh6mDF9O1MDAuiZ9L1T2CR-BcRLD9uPK3XdQay4YaYW2JZhGxxmRTJj9LaAsAc0zNG696oFnbWxICPiRQFB2fP9xeTgUiAUvoJ6JTr0yVjH~evMKXUU62pgEUkujGe139P~DOj4JX0dAHtFFJ4ccpzAMSmShv--XTSk1B4w4I8s~xx5vHmORiaMsh6aHcCEa4RwUfIeFIqhyfCRZ~4PQf~d3RWlYhGnC2ppmfCBYpeCyp6Dx4w6h5Fexzxpz~0lOyrQtL4ie4dhWHL~ebCDKB4qBMFSV4Fgq~RB0Yxc0UECXHbxY5w9tk6RDfGBS6RtBADJGvxE7wXYsI4Q__&Key-Pair-Id=K3LHBTUA5A7KEY)
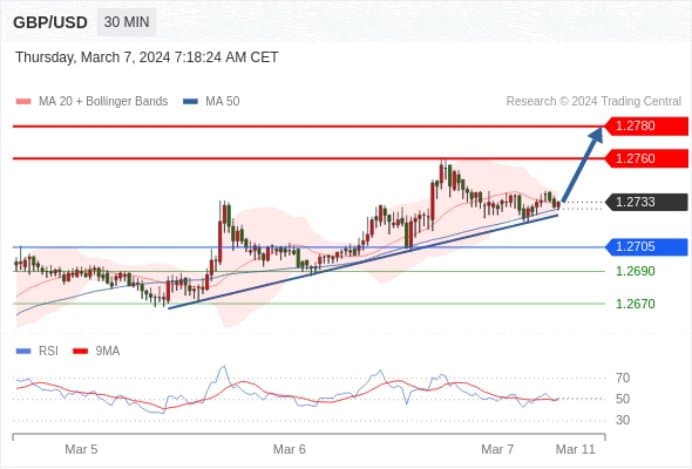
GBP/USD Within the day: Supported by an upward trend line.
Pivot point:
1.2705
Trading strategy:
Above 1.2705, bullish with target prices at 1.2760, followed by 1.2780.
Alternative strategy:
Below 1.2705, bearish with target prices set at 1.2690, followed by 1.2670.
Technical commentary:
RSI technical indicator shows a complex operation trend, leaning towards an increase.
![292fe9a0-1a7c-407b-b095-fb517e2a41d2](https://production-app-asset.traderknows.com/images/22a728e52d16487e93ca3f02733d6f21.width-800.jpg?Expires=1724593952&Signature=yo~WhmWbR4SAKa3dJ~ruUZyaqPE~vXJleR1ea9iF6BeUIRRWxJ2TMUBMGxlZeMxbpezmt3~friRQ~N1cF7BknZjKM2iAVgKwCoE31p44dZSJ6c9IUWoFOT9jTfSviZLI1aySoIWU1y9HumLL2Cj6yJapaVCUht6NMNcA7orDvUrDA8z7SSh5EMjbhS~Ij-doaaRClEbowy34VGOwmDlD8uCoMs0EFOrYrPawL~Wtaqx6gHqw9sn7C9a2IslKheeOH8bz1wZvZI21Z9nNgfXNLRCH-C01WGGuPHN-qdkCiFhA6r-t7YGKCIcl36J5rlZzqXtKMo-5nQoHTy-W65aTng__&Key-Pair-Id=K3LHBTUA5A7KEY)
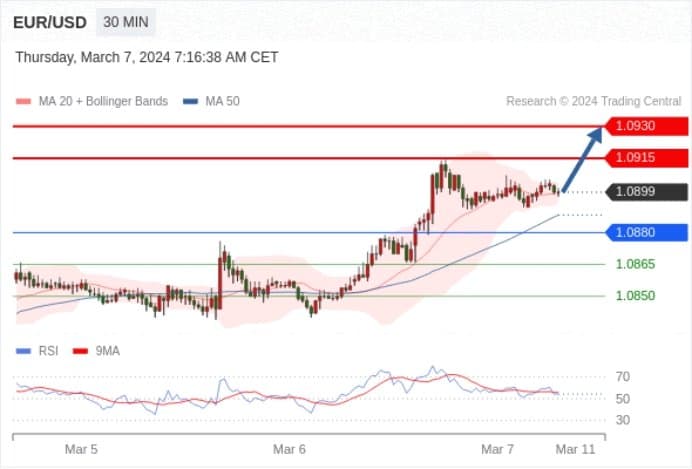
EUR/USD Within the day: Uptrend.
Pivot point:
1.0880
Trading strategy:
Above 1.0880, bullish with target prices at 1.0915, followed by 1.0930.
Alternative strategy:
Below 1.0880, bearish with target prices set at 1.0865, followed by 1.0850.
Technical commentary:
RSI technical indicator shows a complex operation trend, leaning towards an increase.
![bbd36d56-b085-4f09-96f2-8ba81670d3b8](https://production-app-asset.traderknows.com/images/669595f192554ac9bcb6b2eca04b7c74.width-800.jpg?Expires=1724593952&Signature=FV0DjxMjNUGPhZAerigqJjmfzxqtmZsS37cQtxEFOhxR4PB7zDe8lTh-GofRK3fJSkYYV2rR42PHFEOAam9bs43ntNCZVI9BWoco32M4meFRscZnX9dpq80fpEqOOmvfcSLbSTP9Q0pyLbXE40d3I0Ue4~iw5xxWqpLMAaPCLhUOwKc3F05BrigQgp3xpEPpIaewFEQHOVND21Znrk~uq1~qC9tpDAI05MQOghJ7vGhLlzGF1TMPngDnMZwvRC67MpOJVHKgSMpJgp1Lraw8AEKxTO6avtQ98oH6mrueObVzshz-G-R1FnHhuygxVyeefRlxQRSM3ru~DG5GRYZz4w__&Key-Pair-Id=K3LHBTUA5A7KEY)
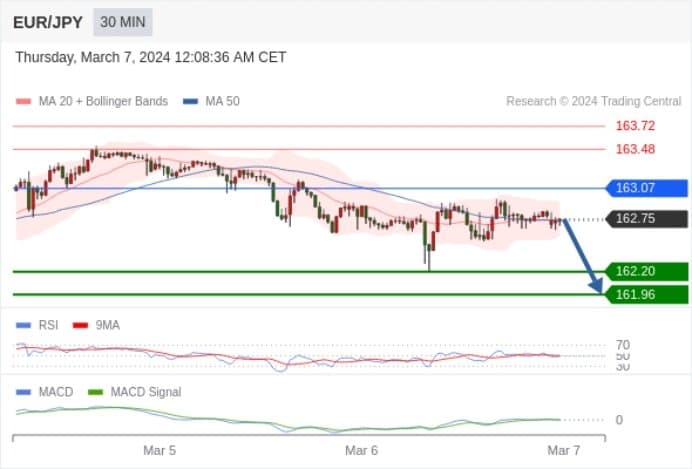
EUR/JPY Within the day: Gradually declining, with 163.07 as a barrier for upward movement and 161.96 as the target.
Pivot point at:
163.07
Trading strategy:
Gradually declining, with 163.07 as a barrier for upward movement and 161.96 as the target.
Alternative strategy:
If breaking through 163.07, EUR/JPY targets 163.48 and 163.72.
Technical commentary:
RSI technical indicator below 50. MACD technical indicator shows a bullish state and is below its signal line. Additionally, the price is below its 20-day moving average (162.75) but above its 50-day moving average (162.74).
![8f1f159f-6849-4499-bdc9-f47390998edf](https://production-app-asset.traderknows.com/images/f32320dee0e145928b277d0139dd98ab.width-800.jpg?Expires=1724593952&Signature=vd8TLTTZ545jA8Vw2LU9~COy6IzC-0O-2zd5TbJJyQpbPpniPrYYgnSiLIBxdbz5EkZHoT89r1EO7fBrW-Eng71djcKONE01Z4PbrivNtCDQlIBddv4BEQCRAbW4HcB6zrZ7QT~z2rVHstq1iMP52hLI5iqtJJvQiifd9X9WymunI2VWVJZ2jaa07B3A1tljmShvSpl~YG4-JhkSE-KVYlPype8ZO2bseEXIoGzz1jez6gEizBhPfze3PTOLyUN-aMRAqPcvzxiejaYRTTyYZCQF0e86L-dZHgHNXyCDtX7huMaON0DCio7F2678rTSdL5d0o5hacwslqwRqomNflw__&Key-Pair-Id=K3LHBTUA5A7KEY)
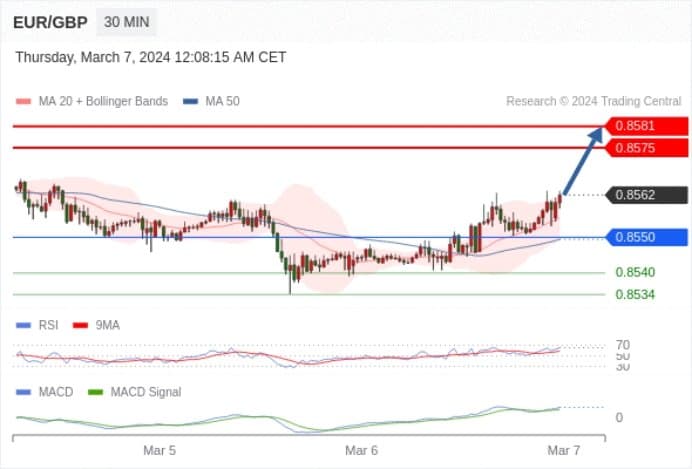
EUR/GBP Within the day: Bullish, with 0.8550 as the support level.
0.8550 as the pivot point.
Trading strategy:
Bullish, with 0.8550 as the support level.
Alternative strategy:
If falling below 0.8550, EUR/GBP target direction is set at 0.8540 and 0.8534.
Technical commentary:
RSI technical indicator greater than the neutral area 50. MACD technical indicator shows a bullish state and is above its signal line. Moreover, the price is above its 20-day and 50-day moving averages (located at 0.8555 and 0.8549, respectively). Finally, the price breaks through the upper band of its Bollinger bands (located at 0.8561).
![a38a292a-0c89-43bd-91e1-c7d2f0bdcbe4](https://production-app-asset.traderknows.com/images/bad6628f125a41e290f8ea22468d8d68.width-800.jpg?Expires=1724593952&Signature=HklaWokXVOA77echAgA46Aw8aDPKjy9IfM99eAOH4t-ei12ZQ0SRi0JFSgEBgmynrT7SzJu5l1ELQZI4SRG1FgECNNZoM-Odki~x7Ieda5eoPJunA2VbfGdBtw~s5FnqHXUoM4OB2z50kj5WUg7oHhHlez18~FXp-lPDetHS5bmKcs9f~0m6Oeok5adrnf6gn0xzg30CJEf9yQ0G01~XUlbBtG3RF41ARugh~59ZbI1VHinb~2dFmB2Ks64Il0hvPPyqJ9kqtVcVwLzXhSzvf4v50dHozfnSoSBTN1NSPgN9G5v4Y1u-Qb~5pQCyfZImMp7ChmkU0VnIx3dTJpA13w__&Key-Pair-Id=K3LHBTUA5A7KEY)
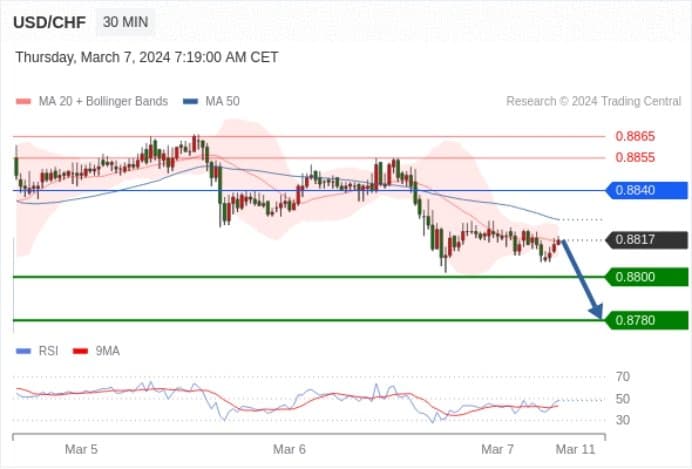
USD/CHF Within the day: Adjustment.
Pivot point:
0.8840
Trading strategy:
Below 0.8840, bearish with target prices at 0.8800, followed by 0.8780.
Alternative strategy:
Above 0.8840, bullish with target prices set at 0.8855, followed by 0.8865.
Technical commentary:
RSI technical indicator shows a complex operation trend, leaning towards a decline.
![6b28b7b7-c8c7-4a4f-a6eb-d0d94a95fd51](https://production-app-asset.traderknows.com/images/a70b37c2a4d3479e81795fc456103a03.width-800.jpg?Expires=1724593952&Signature=U7vD6f2Rthx6YAKrLqkh8gjMotqAdwgzbJr43kM5XPSevV1yed53qIBLOSEi-487AWCzmFoQUnjaoBVheKRalXx8BD0MYwMojk-rHy2auJgXBr9euVDZIoIXqFB2enlkKypPt94OdgbaWh~pbbZqyZyEpjBTyvSbBZ4cbdNoSO3OBQk6RIG9Qwn7b4orj0CbDSgE09Ru9rFwRf27LqHJELnH3IEGxniMGZ0bKyJajNsP9rT5O8~YVFUHvqPpKKtjPZJVVJekMNjGbdMslTfVbot5pQu1ZoWEJEd7-IYBi~3yv4CdDe61kT6Y-9W2PmEq9nz-SJpkJaV4nd8n883a1Q__&Key-Pair-Id=K3LHBTUA5A7KEY)
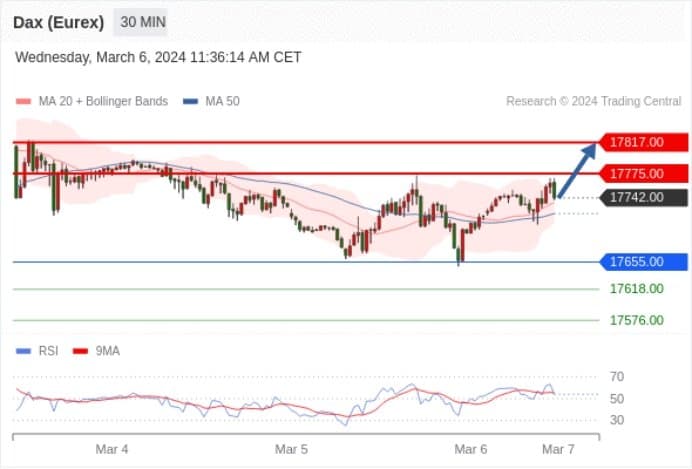
Germany DAX Index Futures (Eurex) (H4) Within the day: No notable change in trend.
Pivot point:
17655.00
Trading strategy:
Above 17655.00, bullish with target prices at 17775.00, followed by 17817.00.
Alternative strategy:
Below 17655.00, bearish with target prices set at 17618.00, followed by 17576.00.
Technical commentary:
A support base around 17655.00 will bring short-term stability in the trend.
![6e407bab-bca1-4435-bec8-d2890e915acd](https://production-app-asset.traderknows.com/images/f800880ad9274c5cabd58b33c2a6bdad.width-800.jpg?Expires=1724593952&Signature=fzRwze~DnhZK6fg5Kyo8k8xf6wWGV-ibXgGxiMIscUiRhb~yRrG2Y5H36Qa8LcZxJozuuw42nRXiXCh5d7ROUdEwWUAVfMk~hhxWCmeC24aRt-9un4BZCNridy4aKQPHJ2iwP6hq2G7pRbEkhapWbsuXCAw2X81Lssw4wQMYFrYlvE7Hudw7TZCqDdqYNWgfNV~3WJyAT9nw3MfNHPAtABpZ2royUiTfDU-rFeKtOSTZGnVsCMQu9gOqDxq3cLes9nSnOM5sz8DdqTRoATw9p4YY88nyFOMOLsKw6RJtxawWKjZ~Ft5qxK5VRYJOxwvLnfRRwfMIQQSLjhv0qWzIcA__&Key-Pair-Id=K3LHBTUA5A7KEY)
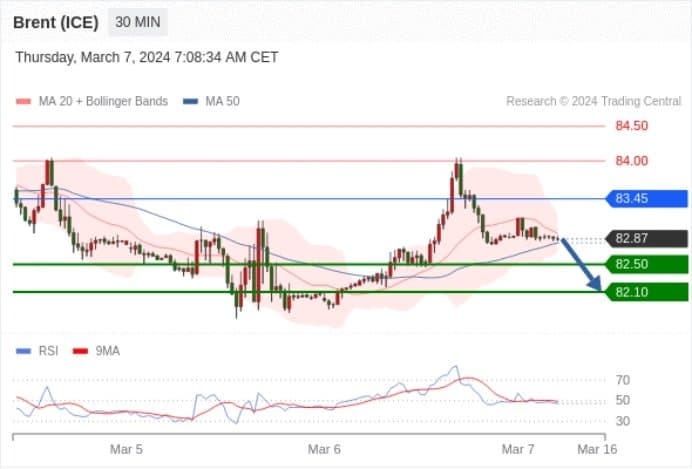
Brent Crude (ICE) (K4) Within the day: Under pressure.
Pivot point:
83.45
Trading strategy:
Below 83.45, bearish with target prices at 82.50, followed by 82.10.
Alternative strategy:
Above 83.45, bullish with target prices set at 84.00, followed by 84.50.
Technical commentary:
RSI technical indicator is bearish, with room for further decline.
![d4dd984a-4a2f-4813-83ab-2bc3901ca5d7](https://production-app-asset.traderknows.com/images/7179e575070f48d0a063045b1de17c9b.width-800.jpg?Expires=1724593952&Signature=TOHCPlUFu7hbRzzOUYfnbSsr8Agvem1DFmBMqtWwsW4yCVGMnMTA-UPxfize4ifrAhjbHCNH1shzpo6zh0a-eKjRP9s~tD4FALsR3NPwhuHDotlCSPVLNlNc~0cAGxYrH11AZEPb0zGkcQB4LgqAqx9JDG8K9w9tLc1Kbj5mGBg4kLo1bRnaGyFzrKHh-eH2GZDt3VYHo3zB~dA8qKGdaHkqFXj32Ch2VPSdPhe1LoMD53dkAp2gyPabz46sRqhHmHrdoKgJmAWG2nAElCcJwjkaj90bojP1Tg-fpP4zt81qimFRi1T17XsujftJ~Yqt~Yr9wHwZ~mHpuJFL-k1quQ__&Key-Pair-Id=K3LHBTUA5A7KEY)
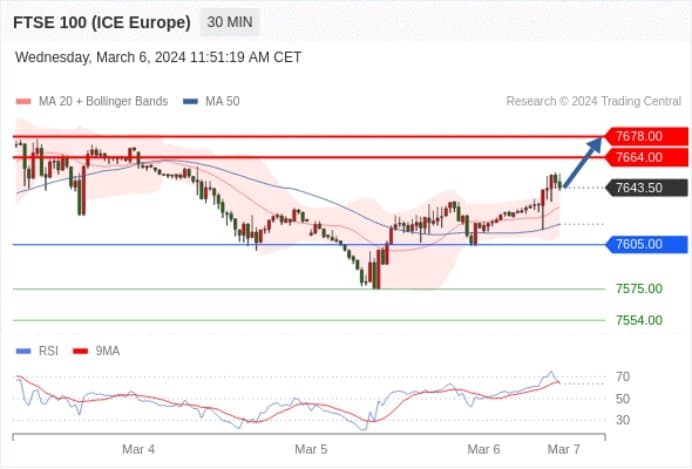
FTSE 100 Index Futures Within the day: Bullish above 7605.00.
Pivot point:
7605.00
Trading strategy:
Above 7605.00, bullish with target prices at 7664.00, followed by 7678.00.
Alternative strategy:
Below 7605.00, bearish with target prices set at 7575.00, followed by 7554.00.
Technical commentary:
RSI technical indicator is bullish, with a further upwards trend.
![74de4b7d-f542-47fd-9e57-52e87b86e594](https://production-app-asset.traderknows.com/images/3f5a0812452b4fcdb3f2f2abf7c32fd0.width-800.jpg?Expires=1724593952&Signature=LnSdIFtnvKYV~kDvijd4At9ehZvBGh6pMyBA8mZoi6Ua-fHsUukuTXzxYTh8LwvSkABuBhW~K59Hhs3teHsfVviD05IfDI~8EfKhAtwZROV7DxYKPG5n1tRuRBqE3Omp-baurfTUH8GI8PQCCP1pyUyCbhBbWh6Zn~-NTmWJKAH~M~rZrwoa4OVUvqCkNoy-DHKiAu1hc5RyAtibKtOBUCGTmRfdHzSXvwylUZT9r70E~eJ-EpjTAKmBT3iX8BQfYSUi8CynZQSlbT9MW3dpOYaslwJ~81ziqVk6D9ZeHBtzPtj1EHgHRLoPvdRQjTPti7O8f1w8s3nO3FRDPeHvLg__&Key-Pair-Id=K3LHBTUA5A7KEY)