Check out today's market insights from the Global Research Department of the Trading Center. Explore new trading methods and opportunities from popular trading products.
EUR/USD Spot Gold GBP/USD EUR/JPY EUR/GBP USD/CHF Germany DAX Index Futures (Eurex) Brent Crude (ICE) UK FTSE 100 Index Futures
Kind Reminder: Due to market volatility, prices may have already moved past key points, rendering strategies ineffective.
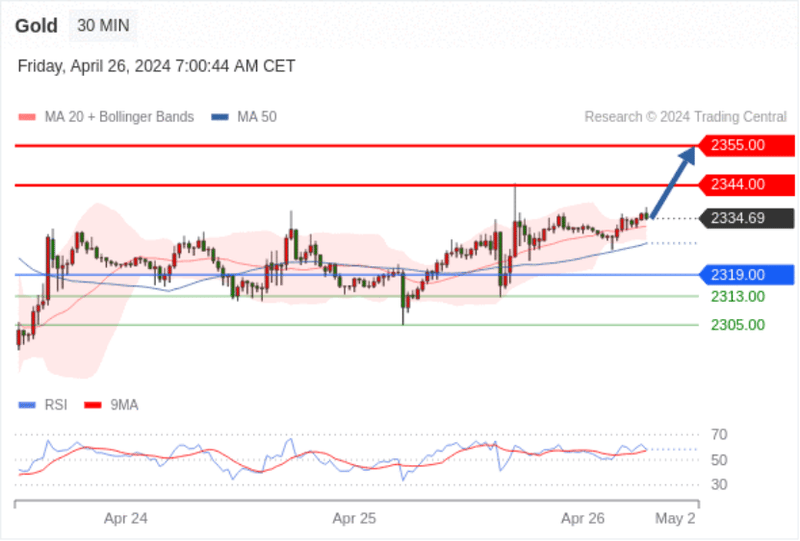
Spot Gold Within the day: Bullish.
Pivot Point:
2319.00
Trading Strategy:
Above 2319.00, target levels at 2344.00, then 2355.00.
Alternative Strategy:
Below 2319.00, bearish with target levels at 2313.00, then 2305.00.
Technical Comment:
The RSI indicator shows a further upward trend.
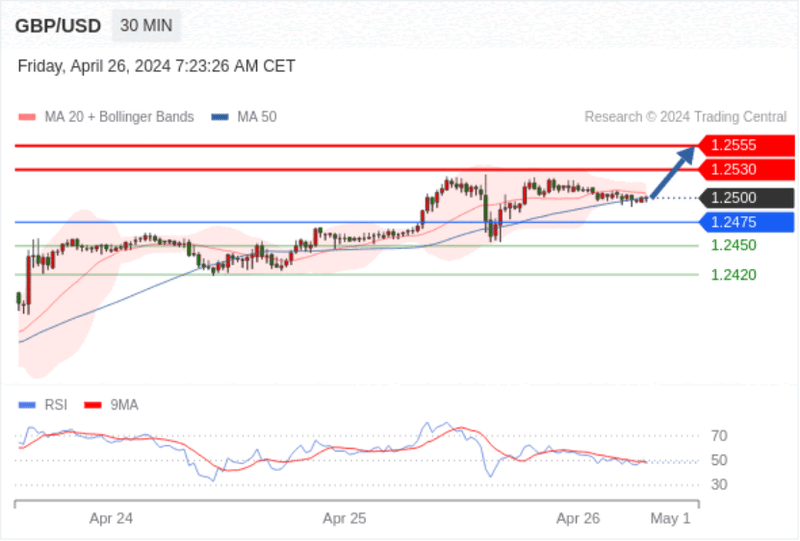
GBP/USD Within the day: Ascending trend.
Pivot Point:
1.2475
Trading Strategy:
Above 1.2475, bullish, with a target at 1.2530, then 1.2555.
Alternative Strategy:
Below 1.2475, bearish, with target levels set at 1.2450, then 1.2420.
Technical Comment:
Even though a continued adjustment is not ruled out, it should be limited in time.
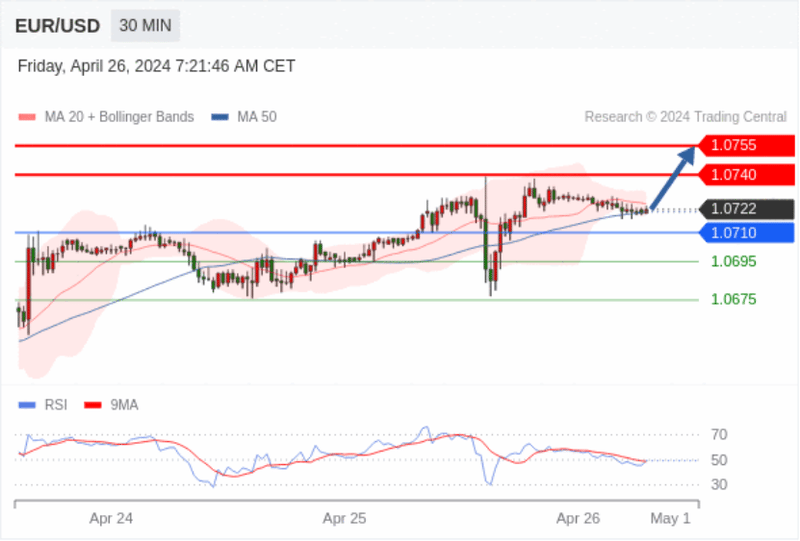
EUR/USD Within the day: Ascending trend.
Pivot Point:
1.0710
Trading Strategy:
Above 1.0710, bullish, target levels at 1.0740, then 1.0755.
Alternative Strategy:
Below 1.0710, bearish, target levels at 1.0695, then 1.0675.
Technical Comment:
The RSI indicator is trending upwards.
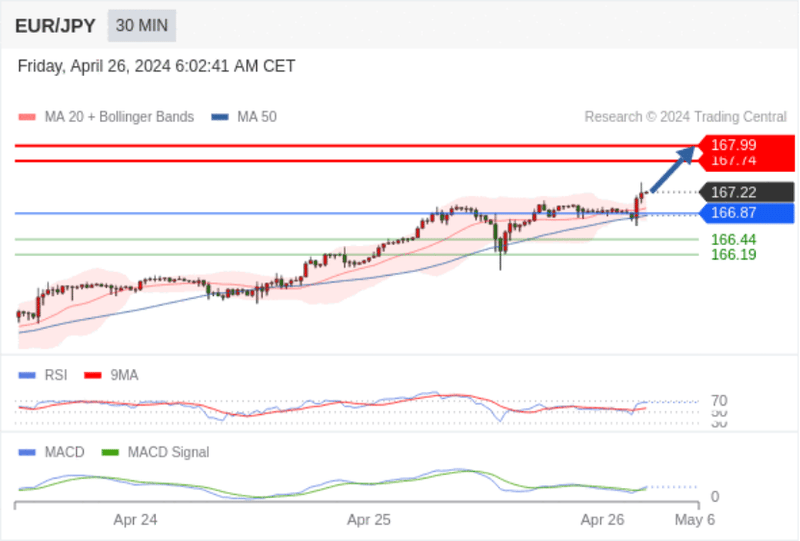
EUR/JPY Within the day: Bullish with 166.87 as the support level.
Pivot Point set at:
166.87
Trading Strategy:
Bullish with 166.87 as the support level.
Alternative Strategy:
If it falls below 166.87, target EUR/JPY direction at 166.44 and 166.19.
Technical Comment :
The RSI indicator is above the neutral zone of 50. The MACD indicator is bullish and above its signal line. Moreover, the price is above its 20-day and 50-day moving averages (currently at 166.96 and 166.84). Finally, the stock price is currently above the upper Bollinger band (positioned at 167.18).
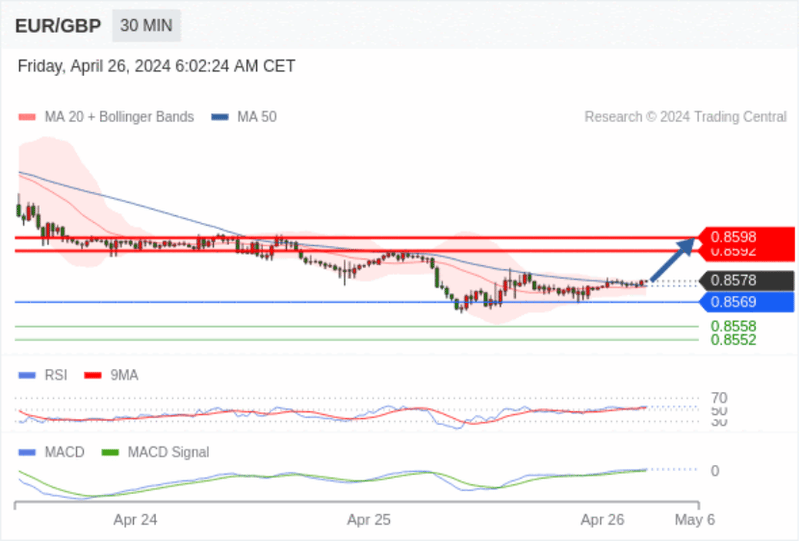
EUR/GBP Within the day: Bullish with 0.8569 as the support level.
Pivot point at:
0.8569
Trading Strategy:
Bullish with 0.8569 as the support level.
Alternative Strategy:
If it falls below 0.8569, target EUR/GBP direction at 0.8558 and 0.8552.
Technical Comment :
The RSI indicator is above the neutral zone of 50. The MACD indicator is bullish and above its signal line. Moreover, the price is above its 20-day and 50-day moving averages (currently at 0.8576 and 0.8576).
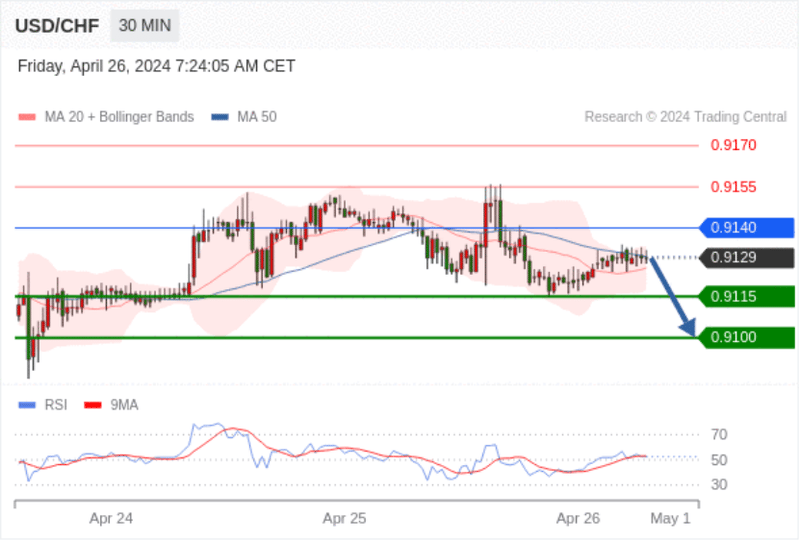
USD/CHF Within the day: Short-term key resistance at 0.9140.
Pivot Point:
0.9140
Trading Strategy:
Below 0.9140, bearish, target levels at 0.9115, then 0.9100.
Alternative Strategy:
Above 0.9140, bullish, target levels at 0.9155, then 0.9170.
Technical Comment:
As long as the 0.9140 resistance level is not breached, the risk of falling below 0.9115 is high.
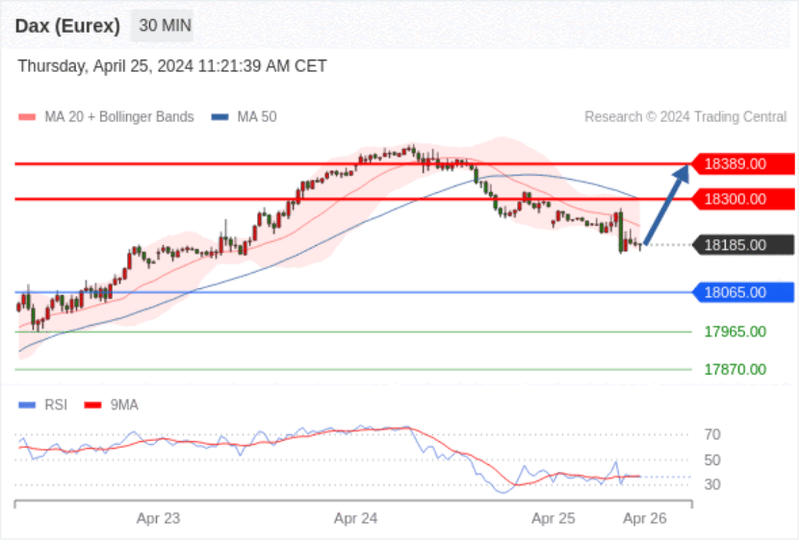
Germany DAX Index Futures (Eurex) (M4) Within the day: Adjustment.
Pivot Point:
18065.00
Trading Strategy:
Above 18065.00, bullish, target levels at 18300.00, then 18389.00.
Alternative Strategy:
Below 18065.00, bearish, target levels at 17965.00, then 17870.00.
Technical Comment:
The RSI indicator lacks downward momentum
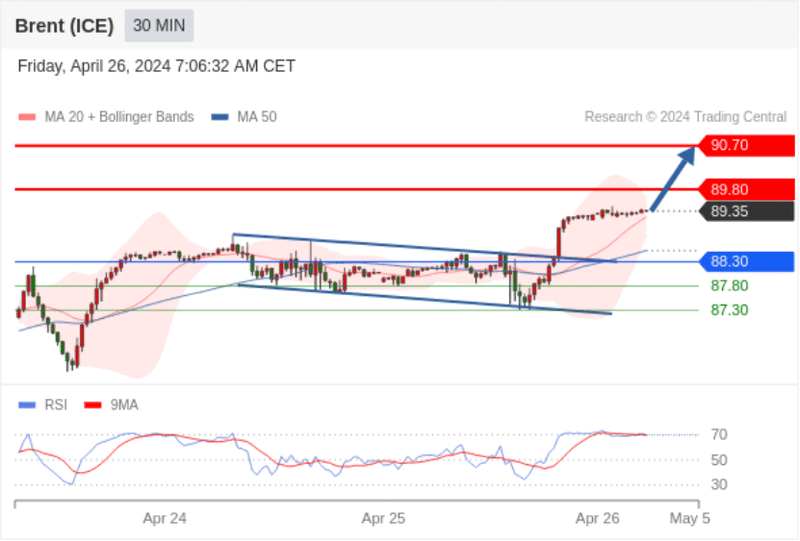
Brent Crude (ICE) (M4) Within the day: Heading towards 90.70.
Pivot Point:
88.30
Trading Strategy:
Above 88.30, bullish, target levels at 89.80, then 90.70.
Alternative Strategy:
Below 88.30, bearish, target levels at 87.80, then 87.30.
Technical Comment:
The RSI indicator shows a continuing upward trend.
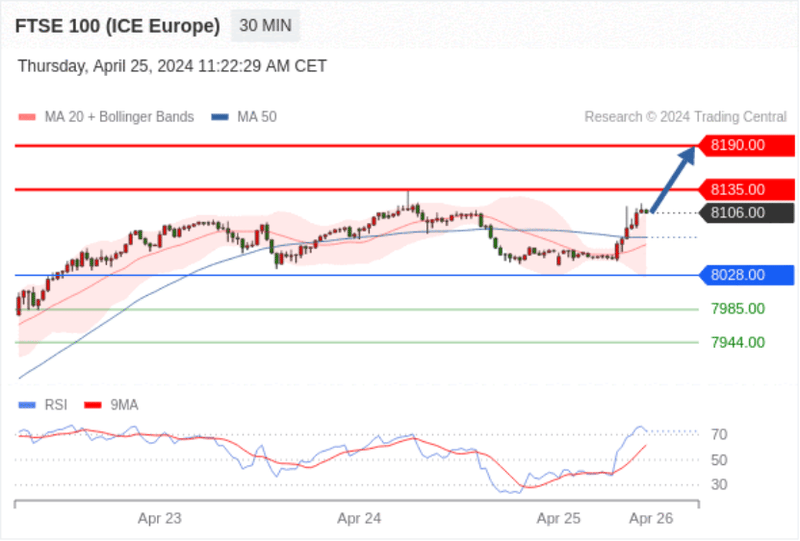
UK FTSE 100 Index Futures Within the day: Bullish.
Pivot Point:
8028.00
Trading Strategy:
Above 8028.00, bullish, target levels at 8135.00, then 8190.00.
Alternative Strategy:
Below 8028.00, bearish, target levels at 7985.00, then 7944.00.
Technical Comment:
The RSI indicator is bullish with a further upward trend.