Explore the latest market perspectives from the global research department at the Trading Center. Discover new trading strategies and opportunities among popular trading products.
EUR/USD Spot Gold GBP/USD EUR/JPY EUR/GBP USD/CHF Germany DAX Index Futures (Eurex) Brent Crude Oil (ICE) UK FTSE 100 Index Futures
Kind reminder: Due to market volatility, prices may have crossed key levels, rendering strategies ineffective.
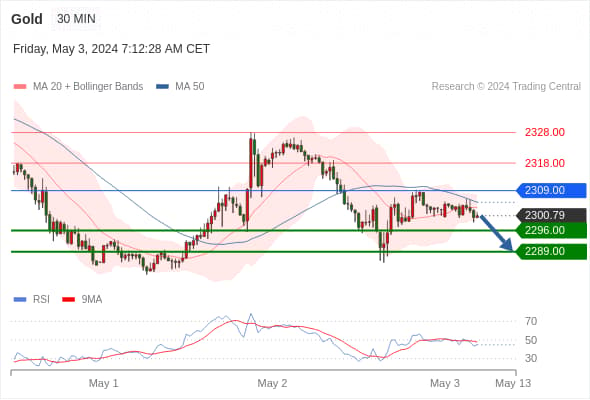
Spot Gold Today: No significant change in trend.
Pivot Point:
2309.00
Trading Strategy:
Below 2309.00, bearish with target prices at 2296.00, followed by 2289.00.
Alternative Strategy:
Above 2309.00, bullish with target prices at 2318.00, followed by 2328.00.
Technical Commentary:
The RSI indicator lacks momentum.
![Image 1](https://production-app-asset.traderknows.com/images/8ab1017e856d4e2285cefaa5dd7bffb2.width-800.png?Expires=1724649250&Signature=IO1nY0exh0n4qj6GExObImK54r-XJE9cRo5KFpDJXOUT04LKdjmN6aQhtsq-76a4EdF0~-uhQBUHJjIOtr6fa9Ga4d5ufiTkmylg6qlp-Q1VehyVvwUkvZOozaU7bYn3QalaFE94JIUwveXiCQwyPS3nHyCjYhv7peRZLaiqQytmOlyfS7xQWCr9~3pjHbujOkAZ3ktMULkfPsHExmWrxXTqc2v~YsfSg2T3BSvVnau~95LVba558m-wnfxmPRbyNBbpDiVdtvqbFIn0OoKlBc43QOPULXYSzlsgJdaZVQwXe~P2xGQvf8UsNRqEKZw36Xawebbmdb6dlEBzsZDpVA__&Key-Pair-Id=K3LHBTUA5A7KEY)
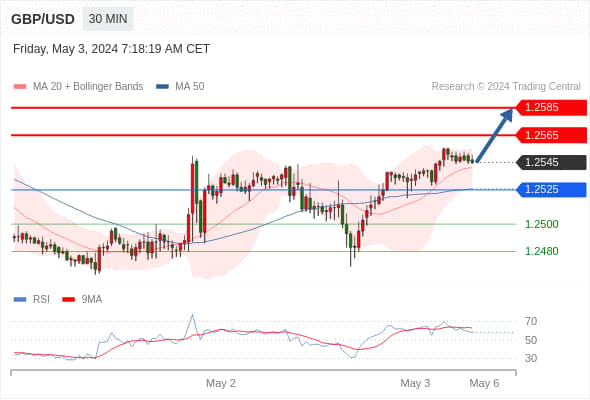
GBP/USD Today: Bullish.
Pivot Point:
1.2525
Trading Strategy:
Above 1.2525, bullish with target prices at 1.2565, followed by 1.2585.
Alternative Strategy:
Below 1.2525, bearish with target prices at 1.2500, followed by 1.2480.
Technical Commentary:
The RSI indicator is trending upwards.
![Image 2](https://production-app-asset.traderknows.com/images/2f3e232fcdef4fc8b3b2e0e492323c25.width-800.png?Expires=1724649250&Signature=B079CbQFOULfpAnydi8AvOZecUmkYj5v4HuHEOfdIKa~sVv8F0BoSjFsXjpwV081vzX1V6DVVEELTO-DbJpDfvvSvSQjUJ60mDAETU74jTbuTmLYutgUqzZPHvk8AzJrce1Rd8drOYRkJf8jSgD9GQNusWCbPT0x8FR9JZSHPom2PO4njsMJcz6vYVB2ExcHTEkyAEnTsyVGprO~xpQtq~ixlHYv17g8epZV0XfMdHwkX8BuMQNP-X1BbX3VJ6u0nGRDg2qWHDGVPqoYre84yYnaft~sJQJpxbs1yQ-Ny95ko0MQGLqwoIJqELmZrTS9RGCP93DEC5k5ddmHFB-awA__&Key-Pair-Id=K3LHBTUA5A7KEY)
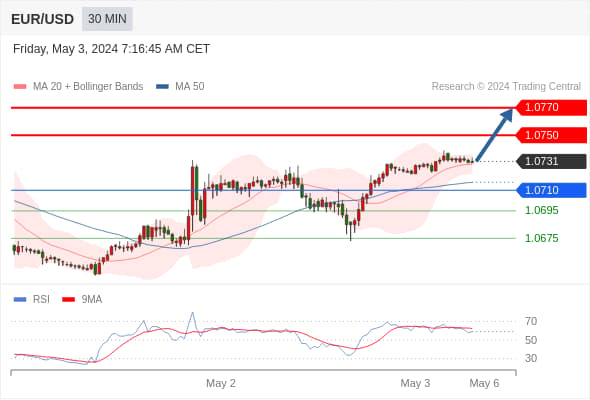
EUR/USD Today: Bullish.
Pivot Point:
1.0710
Trading Strategy:
Above 1.0710, bullish with target prices at 1.0750, followed by 1.0770.
Alternative Strategy:
Below 1.0710, bearish with target prices at 1.0695, followed by 1.0675.
Technical Commentary:
The RSI indicator is trending upwards.
![Image 3](https://production-app-asset.traderknows.com/images/bc1752bd6be243d0ac03348bd7d8c15f.width-800.png?Expires=1724649250&Signature=llS2hy6txd57cS4pekPSf81GbW36tPyn1KFyct9POWGne8wXjRYV5fGPJB9uRt-NbSY7Nvuam00CuqWmhU96U~zAjIV9pDJOgFN9yiU-mDM2-jinI6AjW6cyMP1hu4ZjKfNP7P4uvzV7mSO7XTHgLFhHEmzgsPOvy3ahf9E1juU~wV7VBj3O4nJRx~-JNi5N-2ysFDfGyDQxjRhSVdmjr0O8HWxu5wVr6PXapuyAu2ifLPbqSVQW7VVfQiN9WM2HIN7TJzFwvIA6Zn6bn6sxXGloR3op0NqFI7~8C68lkg~dZIe~EEekumpoySi8o5kPzE5xkh3cCr3qKM1~l62eMQ__&Key-Pair-Id=K3LHBTUA5A7KEY)
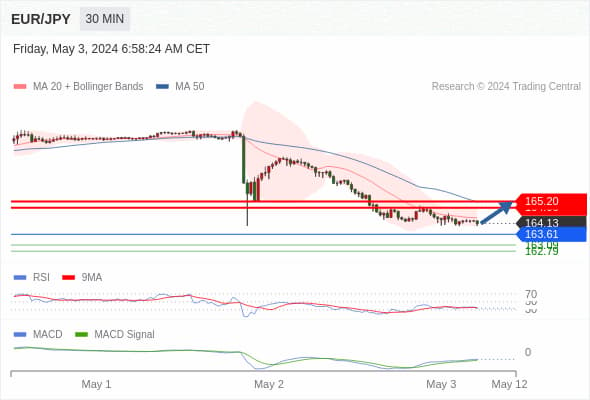
EUR/JPY Today: Potential for an uptrend, with a target price at 165.20.
Pivot Point at 163.61.
Trading Strategy:
Potential for an uptrend, with a target price at 165.20.
Alternative Strategy:
If it falls below 163.61, EUR/JPY target direction is set at 163.09 and 162.79.
Technical Commentary:
RSI below 50. MACD is above its signal line indicating bearishness. Moreover, the price is below its 20 and 50-day moving averages (lying at 164.41 and 165.17 respectively).
![Image 4](https://production-app-asset.traderknows.com/images/8969531b9c0b4babb647412b920d9655.width-800.png?Expires=1724649250&Signature=LGL7DObJK0RkRafZvLJi6I-FHqyXax4N2-u~TLP-XT26qCheTf6PMhSMcZlkIXZG1zezhLPSysF63a3azQLqbZDdB703zWabroc3YkA~GLmeFRIoGjKM2brsE4NAbGxz58Ip0NkUYlk-0dHA5s0ouZXhKVSsRMHTdcQdcpIRGtr7YENM2J8bRACGXWmDsbcF~dr8DGiZA0AVIvKlySC0g0HtnTbjMXmtOn9AqZLX91BhMGH1GBBmeKJd43-848q0zMC5yC5HysTRrxmYPwnphV2XAxtn6ffTpuVQORE33BvnST73elcW8cKqPmacWfticdEyolUWMmNV1X~wBaGWmQ__&Key-Pair-Id=K3LHBTUA5A7KEY)
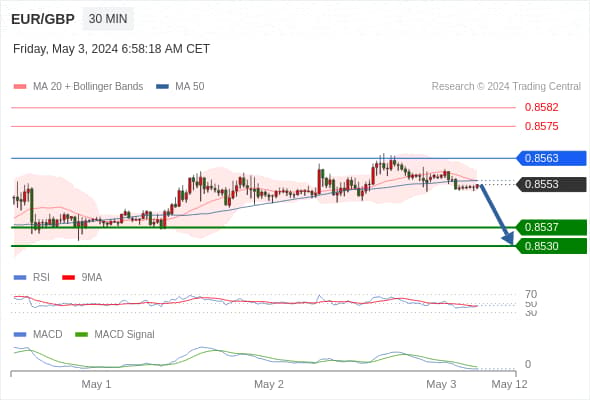
EUR/GBP Today: Bearish, below 0.8563.
Pivot Point set at:
0.8563
Trading Strategy:
Bearish, below 0.8563.
Alternative Strategy:
If it breaks through 0.8563, EUR/GBP target direction is 0.8575 and 0.8582.
Technical Commentary:
RSI below 50. MACD shows bearishness and is below its signal line. Moreover, the price is below its 20 and 50-day moving averages (currently at 0.8555 and 0.8555).
![Image 5](https://production-app-asset.traderknows.com/images/ed37c74cf37143c9bf722b8137cd5210.width-800.png?Expires=1724649251&Signature=NTVp7N1wChxw9EeQXpvx50-kgPuiJa2N8aO55b1yPFAPOzVp4pACmBMoc35WmGk2IgzL0mlqKHTFHtWYA41T3Tv5gEHrnx~6yxrM95x2v-c5LY98bHZhyI6fz2aIwbAVrAOoAvCyaUaw5KVo4buqYi3r9rW3Is8i~cB24bt7wFUlJD9mVmw07cLO50UIl55SWua8RinY92WLy5TrREyuh7i7wJS-jR1GK6jfjjnEXZp7vr7vicJku07cc3~dEVSQ6f~44i-ylJITCxzSSx69RMp6toq-nSj44Mv20xXmI5moejaws8CyGUMGDdY3cPpbdna1aCWGaZYKMXLAF0n2hg__&Key-Pair-Id=K3LHBTUA5A7KEY)
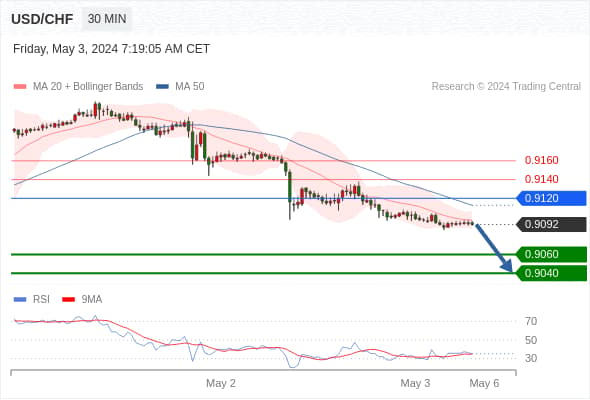
USD/CHF Today: Downward trend.
Pivot Point:
0.9120
Trading Strategy:
Below 0.9120, bearish with target prices at 0.9060, followed by 0.9040.
Alternative Strategy:
Above 0.9120, bullish with target prices at 0.9140, followed by 0.9160.
Technical Commentary:
The RSI indicator is trending downwards.
![Image 6](https://production-app-asset.traderknows.com/images/23223cf001394a3f818ba330e34d8993.width-800.png?Expires=1724649251&Signature=Tz5AStzIYlktWJLMUspZsekmJ57Xny4idBMUCRoD-R65dc2IkBrh5v0gODr8wPzGFMhFBCO53s5jYMxuF2Q0xPxQJl4cF5vMNdlo1P7W44vLZ5XXpWq~VPYATpxDURmRTz4Ys1qqjAD-5gZbD0EXy7X6BXbFv0qip2rl0U3BP32B4FoOpTHpKWpeL2HqmuhpAZC2F0dvpjTM~rSWVTmYPY1AAf3-kl1nNFwBISCaGqCpP~PQQZGlWCXFfv~V3HzvRexyU3vRGqcdfNuqqooXq-9KgZ7-znHXBf~e-bBKBuHMfKtgEUGBSTLpXQrYD9~~VKoC4Pg26VZlpfGjY~7CBw__&Key-Pair-Id=K3LHBTUA5A7KEY)
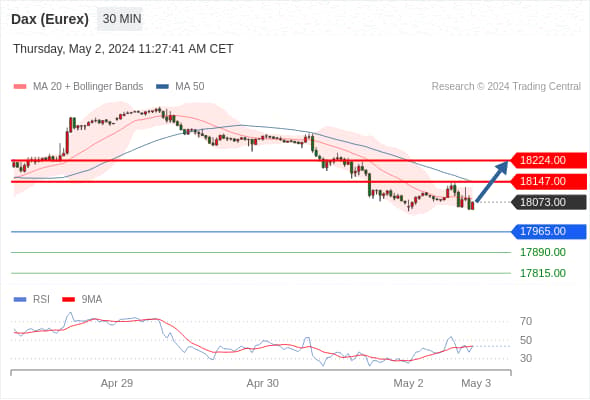
Germany DAX Index Futures (Eurex) (M4) Today: Exercise caution.
Pivot Point:
17965.00
Trading Strategy:
Above 17965.00, bullish with target prices at 18147.00, followed by 18224.00.
Alternative Strategy:
Below 17965.00, bearish with target prices at 17890.00, followed by 17815.00.
Technical Commentary:
The RSI indicator shows a complex trend, leaning towards an upward direction.
![Image 7](https://production-app-asset.traderknows.com/images/1c2c1007e45b47bd9e4c696988a4bdc2.width-800.png?Expires=1724649251&Signature=rUIwX6OGy3hKTuQTbrjNM4GclP1G~tftOZNoC6Ddh3aiX6nY14BqzapI2nkPsFi2LMphOa45yX-Eg1qtw~exoVTTLZkOWK~DwDYpaxvFVI662uP4TQiCwBepEdfrlmaBjXFLKAAj~2STqMIhjvgPNHaCSKcojOZRBPBLL6ozi1LA8pwaPTXAEGw3fGlCe6R0qSefkv7qAY3EMm3KtJtXOiRI6aO2mRHusYHSku3do-z5UpuUF9UdaHD-xM~k8F0ySs4UBQw~Lqv1yNdspYFKQuYcxiSjl~NwX6cYMW6fv5a3bGaba6oeDidKzh0A0HRGukKDkjoFuEJnB19Nzpzc-Q__&Key-Pair-Id=K3LHBTUA5A7KEY)
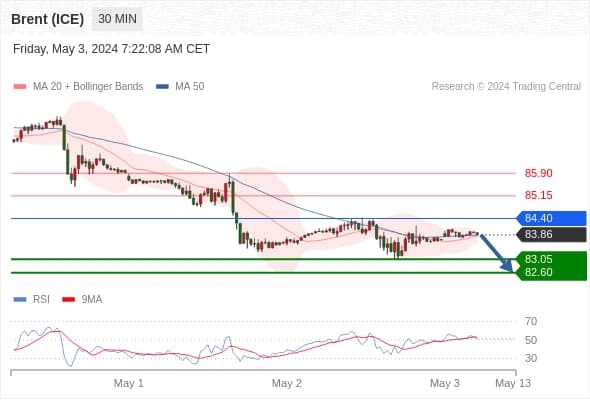
Brent Crude Oil (ICE) (N4) Today: Short-term key resistance at 84.40.
Pivot Point:
84.40
Trading Strategy:
Below 84.40, bearish with target prices at 83.05, followed by 82.60.
Alternative Strategy:
Above 84.40, bullish with target prices at 85.15, followed by 85.90.
Technical Commentary:
The immediate trend remains downward, but lacks momentum.
![Image 8](https://production-app-asset.traderknows.com/images/4be7959ac6b949c09c3d1e400647ce90.width-800.png?Expires=1724649251&Signature=DBgh6U5-kgYUAnuyVDvnbU5d0ObRLuhe4Lv7dXyI5nHjKRy1sn0j~0qoL5-UAkXB1LRAl2ZxCRjJRv3pvSD~GIQ9GsaBSyNtN4iv8S74PwYZZ~38cIjnDqyxKFMOJ3UrIlZSpbCjQkTjzpYSbN2ix9nQz2XpCcqYsSRmq1yWXZkWxZCXHJL75iRPENyGcbeHKJXKndBhJOYGFAgY0Jus52hPkxkaj107QdzIAbdHs0US~lSu6QIcPLwDlG~bVcc7fl5gThXYD5OC0mWiza7o3TLF~l0azKXY1TTQ7ww-VRu1djIHeIouqHwfGibsF3YTvdNQyctZrdIrCOTQk~xCbQ__&Key-Pair-Id=K3LHBTUA5A7KEY)
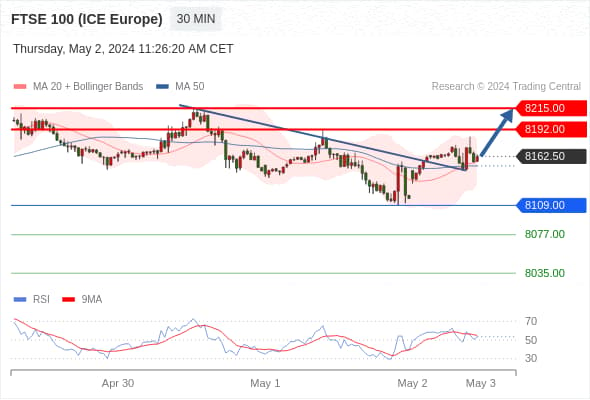
UK FTSE 100 Index Futures Today: Bullish, above 8109.00.
Pivot Point:
8109.00
Trading Strategy:
Above 8109.00, bullish with target prices at 8192.00, followed by 8215.00.
Alternative Strategy:
Below 8109.00, bearish with target prices at 8077.00, followed by 8035.00.
Technical Commentary:
The RSI indicator shows a complex trend, leaning towards an upward direction.
![Image 9](https://production-app-asset.traderknows.com/images/9e6bb5aa0ef34aee886d8d0d36a97318.width-800.png?Expires=1724649251&Signature=JEmWubKMWxcSVlUHT-iOupN-vDZkmzZ8o9bet6t0c8qxiO0Bv5U5UoXaT1ZBLUBP5fsFPSD53LpBNUTRNLg47W49DIv7nZmt639DUATx1~rIle0ROvkU06ylA4XN3oEkY-WkoQcq07lLtdMcObAeR6IdRGRZjB6kxwQGnTdSsH8Mf7Ni90QfaJGRwV8YX0iaZgLZ4bT7A6IVBeZJ1q5OwFo06KRdJb8H9nCS-JQa1osbpci2JiBKXQjKWZGnSP-zq8~aTuZKKw1QgNFuURzUmdPmordwzqz7Yt7p~1LmuFT56j1oDwNayU91BwsiZPpBqs-ieE90qXg9zUHWFdS5kA__&Key-Pair-Id=K3LHBTUA5A7KEY)