• Home
  • Categories
  • News
  • Community
EN
EN
Home
CategoriesNewsGlossaryCommunity
Contact Us
Social Media
Region
🌏International
Region
🌏International
Contact
Home
/
News
/
Evening Star Candlestick Pattern.

Evening Star Candlestick Pattern.

TraderKnows IndiaTraderKnows India
2024-09-23
Summary:The Evening Star candlestick pattern is one of the most reliable indicators for traders to identify potential market reversals.

How to Trade the Evening Star Candlestick Pattern:

The Evening Star candlestick pattern is one of the most reliable indicators used by traders to identify potential reversals in the market, especially after an uptrend. This pattern signals the transition from bullish to bearish sentiment, providing traders with an opportunity to enter a short position. Here’s how to recognize and trade the Evening Star pattern effectively.

a3.png

What is the Evening Star Candlestick Pattern?

The Evening Star is a three-candle formation that typically appears at the top of an uptrend.

It consists of:

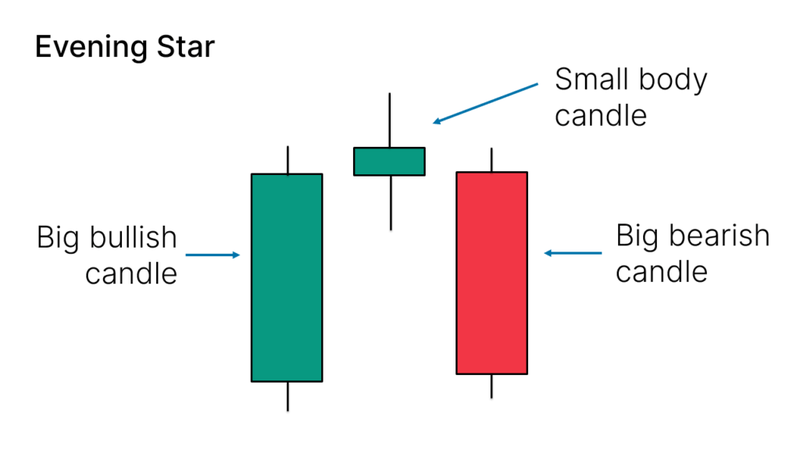
1. First Candle (Bullish): A large bullish candle that indicates the continuation of the uptrend.

2. Second Candle (Small Body): A smaller candle, which can be either bullish or bearish, but usually shows indecision in the market. This candle opens with a gap up but closes with little movement.

3. Third Candle (Bearish): A strong bearish candle that closes near or below the midpoint of the first candle, signaling a reversal in trend.

a5.jpg

How to Identify the Evening Star Pattern?

To successfully trade the Evening Star, you need to ensure the following conditions are met:

  • The first candle is a large bullish (green) candle, showing the uptrend is still intact.
  • The second candle should open with a gap up and have a small body, indicating indecision in the market.
  • The third candle should be a strong bearish (red) candle that closes well into the body of the first candle.

Trading the Evening Star Pattern:

Once you’ve identified the pattern, follow these steps to execute a trade:

1. Confirmation: Wait for confirmation that the trend is reversing. This often comes with the third bearish candle closing below the midpoint of the first candle. The pattern is stronger when it forms at a significant resistance level.

2. Enter the Trade: Enter a short position at the open of the next candle after the pattern is confirmed. Alternatively, you can wait for a slight pullback to enter the trade at a better price.

3. Set Stop-Loss: Place your stop-loss above the high of the second candle (the small-bodied one). This protects your trade from invalidating the pattern if the price reverses back upwards.

4. Take Profit: You can set your profit target at a key support level below or use a risk-to-reward ratio of 1:2 or 1:3 depending on your trading strategy.

Example of the Evening Star in Action: Imagine a stock has been in an uptrend, and suddenly an Evening Star pattern forms at a key resistance level. The first bullish candle is followed by a small candle, indicating a slowdown in buying pressure. The third bearish candle closes below the first candle’s midpoint, confirming the pattern. You enter a short position, place your stop-loss above the second candle's high, and target the nearest support level for profit.

Final Thoughts:

The Evening Star candlestick pattern is a powerful reversal signal in technical analysis, especially when used in conjunction with other indicators like moving averages or support and resistance levels. Like all patterns, it's essential to wait for confirmation and manage risk with a well-placed stop-loss. By following these steps, traders can enhance their ability to spot and capitalize on bearish reversals in the market.

footer new.jpeg

Risk Warning and Disclaimer

The market carries risks, and investment should be cautious. This article does not constitute personal investment advice and has not taken into account individual users' specific investment goals, financial situations, or needs. Users should consider whether any opinions, viewpoints, or conclusions in this article are suitable for their particular circumstances. Investing based on this is at one's own responsibility.

The End
Previous
Next

Comments

0/1000

You Missed

Why are fewer and fewer people trading? Perhaps this article can provide you with the answer.

Why are fewer and fewer people trading? Perhaps this article can provide you with the answer.

According to data provided by brokers, 40% of traders give up trading after one month, and only 7% remain active after five years.

亚伦_TK_LOXmv
亚伦_TK_LOXmv
2024-06-04
Investment
Investment
2024-06-04
Major indices fell as AI surged but semiconductors dragged sentiment.

Major indices fell as AI surged but semiconductors dragged sentiment.

On November 15th, A-shares fell as AI gained, but semiconductors and photovoltaics plunged, with over 3,100 stocks declining.

2024-11-15
Stock price
Stock price
2024-11-15
Powell highlighted U.S. economic strength, noting cautious rate cuts; market reaction was mixed.

Powell highlighted U.S. economic strength, noting cautious rate cuts; market reaction was mixed.

Fed Chair Jerome Powell stated the strong U.S. economy allows for a measured pace in adjusting interest rates, pressuring the stock market to decline while Treasury yields rise.

2024-11-15
Stock Market Volatility
2024-11-15
What is Hoarding and Profiteering? Five Questions about Hoarding and Profiteering You Need to Know

What is Hoarding and Profiteering? Five Questions about Hoarding and Profiteering You Need to Know

Hoarding is stockpiling goods to inflate prices for profit, seen in commodity markets, especially with essential products, driven by greed.

TraderKnows
TraderKnows
2024-04-30
2024-04-30
Australian Strikes Tear Through the Calm Facade of the Liquefied Gas Market

Australian Strikes Tear Through the Calm Facade of the Liquefied Gas Market

If no agreement is reached or hints of supply threats arise, it could panic the market. This reminds us that after last year's LNG price surge, any tension could cause significant price fluctuations.

TraderKnows
TraderKnows
2024-05-06
New York Mercantile Exchange
2024-05-06

Wiki

Dealer Market

The dealer market, also known as the over-the-counter market, is a financial market where participants provide liquidity themselves and independently decide on the buying and selling of the underlying assets.

Recent Post

UN cuts global growth forecast amid tariffs and uncertainty.

05-16

UAE Places Boeing Order as Trump Signs Major Agreement

05-16

The U.S. and Japan collaborate to develop the rare earth industry chain.

05-16

Grain futures show mixed trends, with policy and exports dominating market sentiment.

05-16

Berkshire Q1 Holdings: Cuts Bank of America, Keeps Apple

05-16

Liquid Brokers Review: Key Concerns & Operational Red Flags Uncovered

05-16

The dollar retracts as the market shifts towards safe-haven currencies.

05-16

Oil prices remain stable, pressured by the prospects of the US-Iran nuclear agreement.

05-16

Powell: The Era of Low Interest Rates is Unlikely to Return

05-16

Negotiations between Russia and Ukraine have stalled, and Trump has spoken out.

05-16

U.S. Treasury yields fell sharply, boosting rate cut expectations.

05-16

The Federal Reserve maintains interest rates, warning of tariff inflation risks.

05-15

The EU refuses to compromise as trade tensions between the US and Europe escalate.

05-15

U.S. Treasury bonds continue to be sold off, with yields approaching the 5% mark.

05-15

Trump is holding off on attending Russia-Ukraine peace talks, observing Putin's actions.

05-15

You Missed

Why are fewer and fewer people trading? Perhaps this article can provide you with the answer.

Why are fewer and fewer people trading? Perhaps this article can provide you with the answer.

According to data provided by brokers, 40% of traders give up trading after one month, and only 7% remain active after five years.

亚伦_TK_LOXmv
亚伦_TK_LOXmv
2024-06-04
Investment
Investment
2024-06-04
Major indices fell as AI surged but semiconductors dragged sentiment.

Major indices fell as AI surged but semiconductors dragged sentiment.

On November 15th, A-shares fell as AI gained, but semiconductors and photovoltaics plunged, with over 3,100 stocks declining.

2024-11-15
Stock price
Stock price
2024-11-15
Powell highlighted U.S. economic strength, noting cautious rate cuts; market reaction was mixed.

Powell highlighted U.S. economic strength, noting cautious rate cuts; market reaction was mixed.

Fed Chair Jerome Powell stated the strong U.S. economy allows for a measured pace in adjusting interest rates, pressuring the stock market to decline while Treasury yields rise.

2024-11-15
Stock Market Volatility
2024-11-15
What is Hoarding and Profiteering? Five Questions about Hoarding and Profiteering You Need to Know

What is Hoarding and Profiteering? Five Questions about Hoarding and Profiteering You Need to Know

Hoarding is stockpiling goods to inflate prices for profit, seen in commodity markets, especially with essential products, driven by greed.

TraderKnows
TraderKnows
2024-04-30
2024-04-30
Australian Strikes Tear Through the Calm Facade of the Liquefied Gas Market

Australian Strikes Tear Through the Calm Facade of the Liquefied Gas Market

If no agreement is reached or hints of supply threats arise, it could panic the market. This reminds us that after last year's LNG price surge, any tension could cause significant price fluctuations.

TraderKnows
TraderKnows
2024-05-06
New York Mercantile Exchange
2024-05-06

Risk Warning

TraderKnows is a financial media platform, with information displayed coming from public networks or uploaded by users. TraderKnows does not endorse any trading platform or variety. We bear no responsibility for any trading disputes or losses arising from the use of this information. Please be aware that displayed information may be delayed, and users should independently verify it to ensure its accuracy.