Explore new trading methods and opportunities from popular trading products in today's market viewpoint from the Global Research Department of the Trading Center.
EUR/USD GBP/USD Spot Gold EUR/JPY EUR/GBP USD/CHF German DAX Index Futures (Eurex) Brent Crude Oil (ICE) UK FTSE 100 Index Futures
Kind Reminder: Due to market fluctuations, prices may have moved past critical points, rendering strategies ineffective.
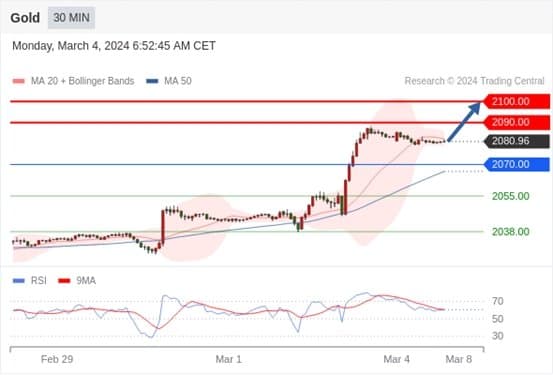
Spot Gold For intraday: Short-term (intraday) support around 2070.00.
Pivot Point:
2070.00
Trading Strategy:
Bullish above 2070.00, with target prices at 2090.00 and then 2100.00.
Alternative Strategy:
Bearish below 2070.00, with target prices at 2055.00 and then 2038.00.
Technical Commentary:
Subsequent resistance is at 2090.00, followed by 2100.00.
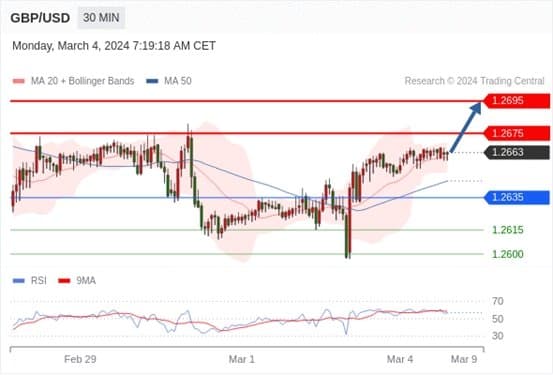
GBP/USD For intraday: A new round of increase.
Pivot Point:
1.2635
Trading Strategy:
Bullish above 1.2635, with target prices at 1.2675 and then 1.2695.
Alternative Strategy:
Bearish below 1.2635, with target prices at 1.2615 and then 1.2600.
Technical Commentary:
The RSI technical indicator is moving upwards.
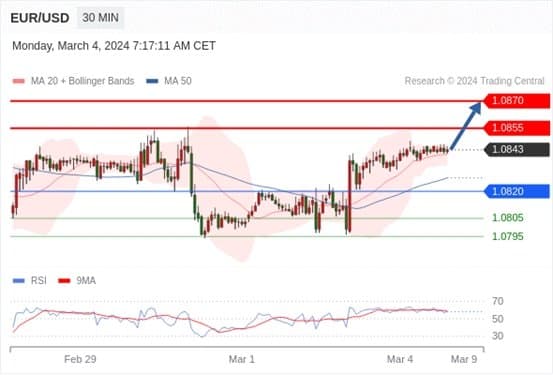
EUR/USD For intraday: Uptrend.
Pivot Point:
1.0820
Trading Strategy:
Bullish above 1.0820, with target prices at 1.0855 and then 1.0870.
Alternative Strategy:
Bearish below 1.0820, with target prices at 1.0805 and then 1.0795.
Technical Commentary:
The RSI technical indicator is moving upwards.
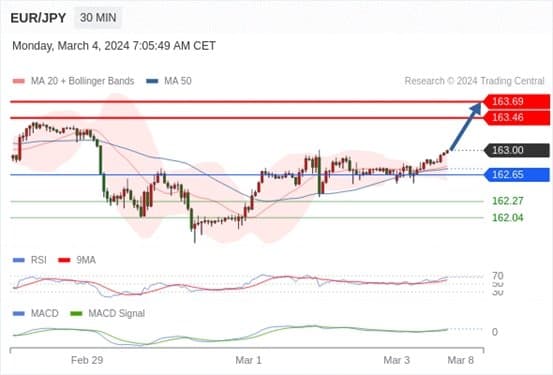
EUR/JPY For intraday: Bullish, with support at 162.65.
162.65 as the Pivot Point.
Trading Strategy:
Bullish, with support at 162.65.
Alternative Strategy:
A breach below 162.65 indicates a continuing downtrend, with target prices at 162.27 followed by 162.04.
Technical Commentary:
The RSI technical indicator is above the neutral 50 zone. The MACD technical indicator is bullish and above its signal line. Moreover, the price is above its 20-day and 50-day moving averages (located at 162.77 and 162.74, respectively). Finally, the price has broken through the upper band of its Bollinger Bands (located at 162.98).
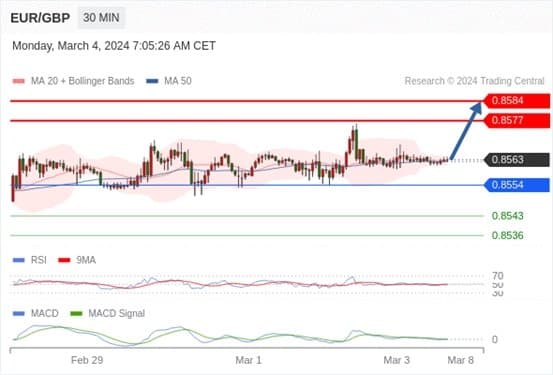
EUR/GBP For intraday: Bullish, with support at 0.8554, targets set at 0.8584.
0.8554 as the Pivot Point.
Trading Strategy:
Bullish, with support at 0.8554, targets set at 0.8584.
Alternative Strategy:
A break below 0.8554 suggests a continuing downtrend, with target prices at 0.8543 followed by 0.8536.
Technical Commentary:
The RSI technical indicator is above the neutral 50 zone. The MACD technical indicator is bullish and below its signal line. Moreover, the price is above its 20-day and 50-day moving averages (located at 0.8563 and 0.8562, respectively).
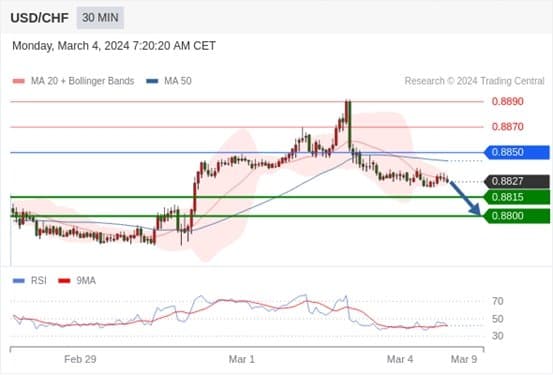
USD/CHF For intraday: Under pressure.
Pivot Point:
0.8850
Trading Strategy:
Bearish below 0.8850, with target prices at 0.8815 and then 0.8800.
Alternative Strategy:
Bullish above 0.8850, with target prices at 0.8870 and then 0.8890.
Technical Commentary:
The RSI technical indicator is moving downwards.
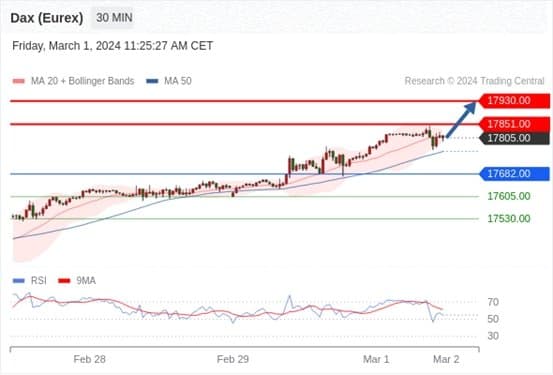
German DAX Index Futures (Eurex) (H4) For intraday: Uptrend.
Pivot Point:
17682.00
Trading Strategy:
Bullish above 17682.00, with target prices at 17851.00 and then 17930.00.
Alternative Strategy:
Bearish below 17682.00, with target prices at 17605.00 and then 17530.00.
Technical Commentary:
The RSI technical indicator is near the 50% neutral area.
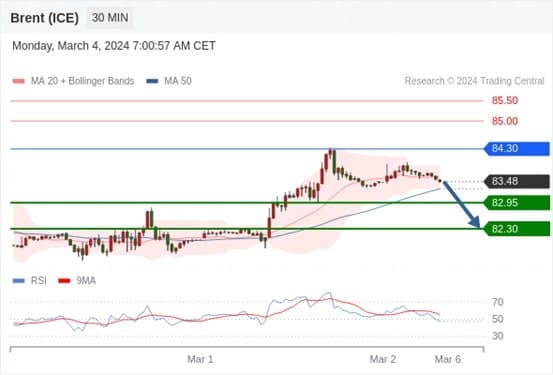
Brent Crude Oil (ICE) (K4) For intraday: A short-term adjustment.
Pivot Point:
84.30
Trading Strategy:
Bearish below 84.30, with target prices at 82.95 and then 82.30.
Alternative Strategy:
Bullish above 84.30, with target prices at 85.00 and then 85.50.
Technical Commentary:
As long as the resistance at 84.30 remains, there is a bearish trend in price fluctuations.
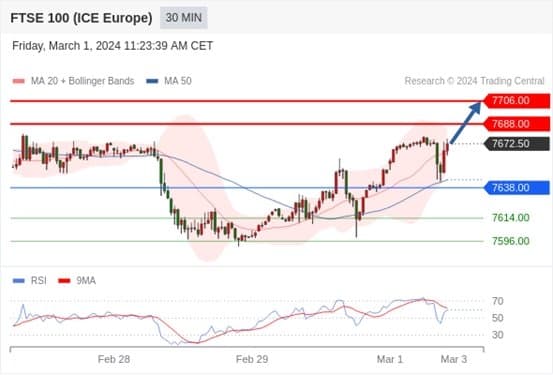
UK FTSE 100 Index Futures For intraday: Bullish.
Pivot Point:
7638.00
Trading Strategy:
Bullish above 7638.00, with target prices at 7688.00 and then 7706.00.
Alternative Strategy:
Bearish below 7638.00, with target prices at 7614.00 and then 7596.00.
Technical Commentary:
The RSI technical indicator is bullish, indicating a further upward trend.