Check out today's market insights from the Global Research Department of the Trading Center. Explore new trading methods and opportunities from popular trading products.
EUR/USD GBP/USD Spot Gold EUR/JPY EUR/GBP USD/CHF Germany DAX Index Futures (Eurex) Brent Crude (ICE) UK FTSE 100 Index Futures
Kindly note: Due to market fluctuations, prices may have moved past key points, rendering strategies ineffective.
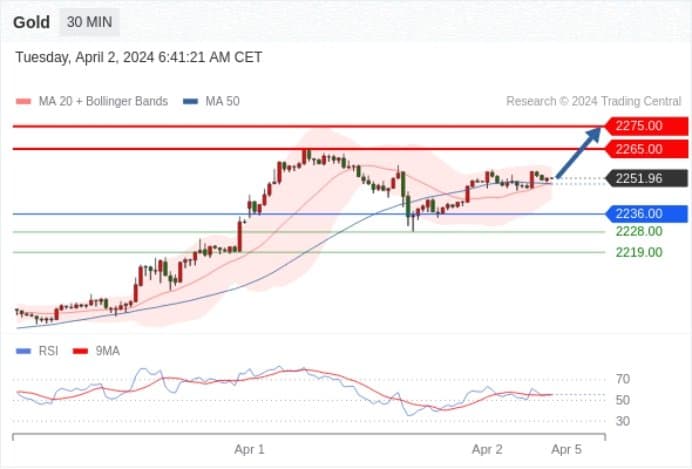
Spot Gold Throughout the day: Bullish above 2236.00.
Pivot point:
2236.00
Trading strategy:
Bullish above 2236.00, with target prices at 2265.00, followed by 2275.00.
Alternative strategy:
Bearish below 2236.00, with target prices at 2228.00, then 2219.00.
Technical comments:
RSI indicator signals bullishness.
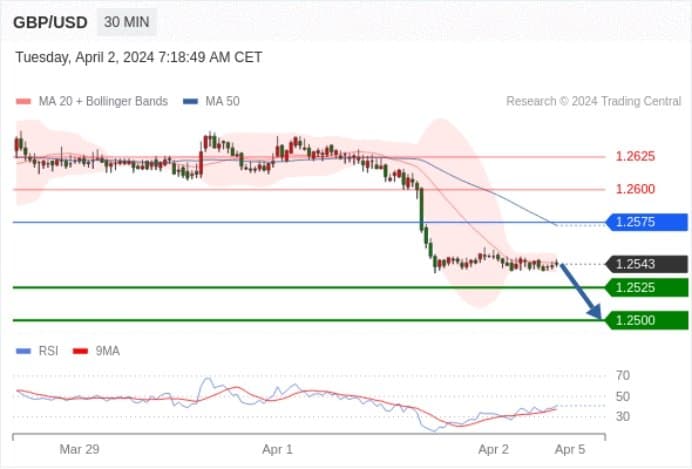
GBP/USD Throughout the day: Immediate resistance at 1.2575.
Pivot point:
1.2575
Trading strategy:
Bearish below 1.2575, with target prices at 1.2525, then 1.2500.
Alternative strategy:
Bullish above 1.2575, with target prices at 1.2600, followed by 1.2625.
Technical comments:
As long as the resistance of 1.2575 is not breached, there's a high chance of breaking below 1.2525.
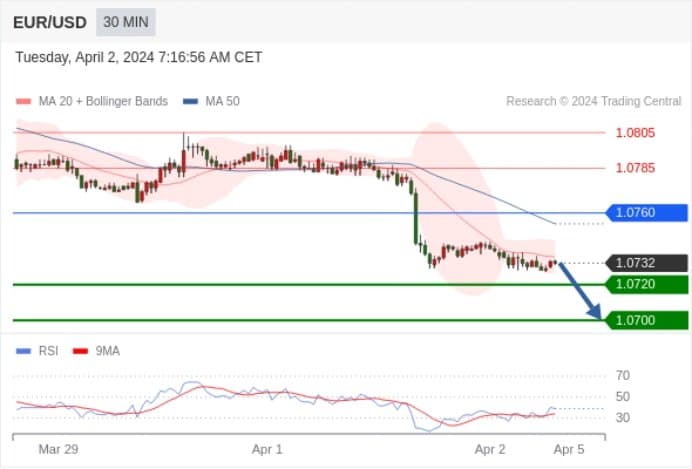
EUR/USD Throughout the day: Under pressure.
Pivot point:
1.0760
Trading strategy:
Bearish below 1.0760, with target prices at 1.0720, then 1.0700.
Alternative strategy:
Bullish above 1.0760, with target prices at 1.0785, followed by 1.0805.
Technical comments:
The RSI indicator's trend is complex, leaning towards a decline.
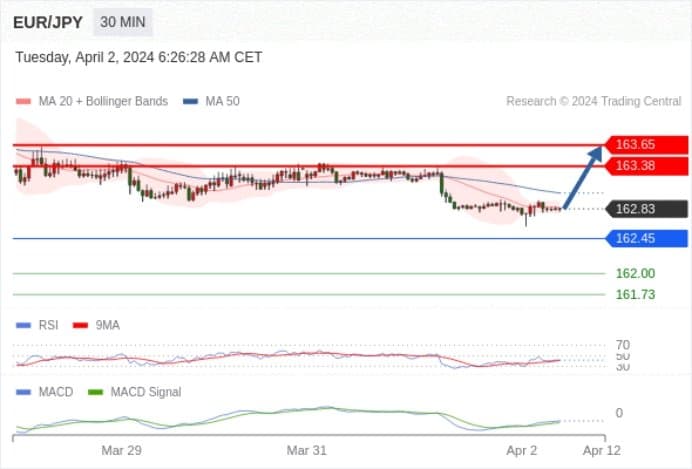
EUR/JPY Throughout the day: Potential for a rise, with targets at 163.65.
The pivot point is:
162.45
Trading strategy:
Potential for a rise, with targets at 163.65.
Alternative strategy:
If it falls below 162.45, EUR/JPY target directions are set at 162 and 161.73.
Technical comments :
The RSI indicator is below 50. MACD indicator is bearish and above its signal line. Moreover, prices are below their 20-day and 50-day moving averages (situated at 162.85 and 163.03, respectively).
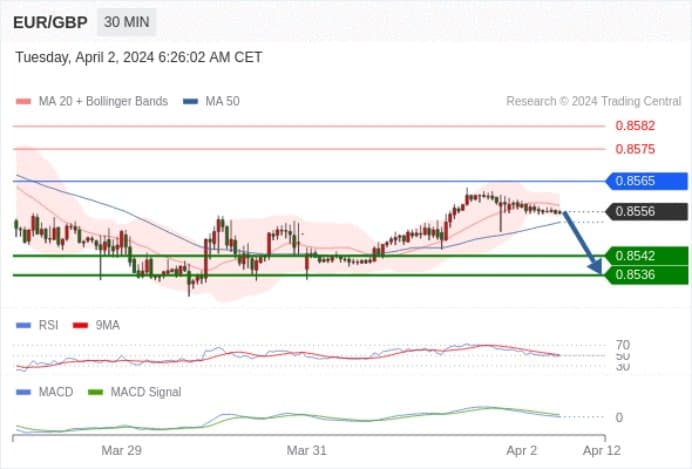
EUR/GBP Throughout the day: Gradual decline, if 0.8565 hinders upward movement, then aim for 0.8536.
0.8565 as the pivot point.
Trading strategy:
Gradual decline, if 0.8565 hinders upward movement, then target 0.8536.
Alternative strategy:
Breaking above 0.8565 will bring a continuing upward trend, with targets at 0.8575 and 0.8582.
Technical comments :
The RSI indicator is below the neutral zone 50. MACD is bullish and below its signal line. Besides, the price is below its 20-day moving average (0.8558) but above its 50-day moving average (0.8552).
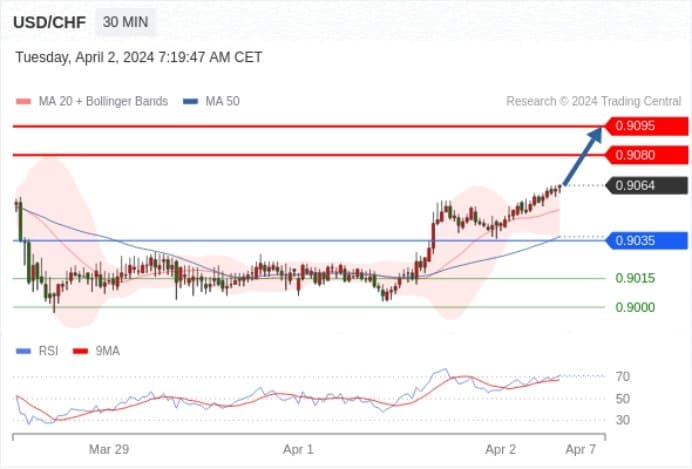
USD/CHF Throughout the day: Further uptrend.
Pivot point:
0.9035
Trading strategy:
Bullish above 0.9035, with target prices at 0.9080, then 0.9095.
Alternative strategy:
Bearish below 0.9035, with target prices at 0.9015, then 0.9000.
Technical comments:
RSI indicator is bullish, indicating a potential for further uptrend.
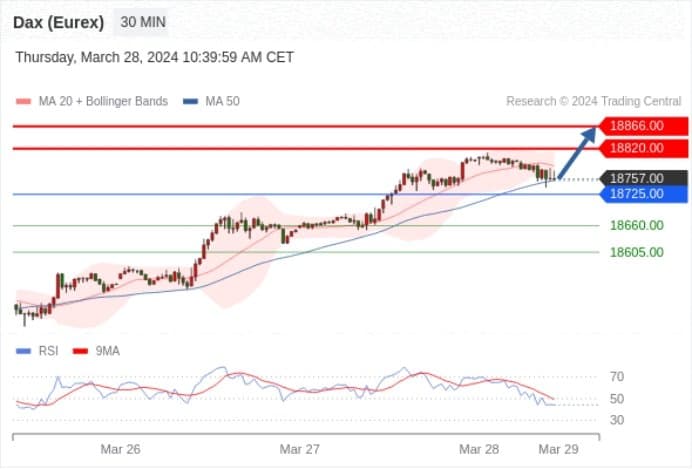
Germany DAX Index Futures (Eurex) (M4) Throughout the day: Bullish above 18725.00.
Pivot point:
18725.00
Trading strategy:
Bullish above 18725.00, with target prices at 18820.00, then 18866.00.
Alternative strategy:
Bearish below 18725.00, with target prices at 18660.00, then 18605.00.
Technical comments:
RSI indicator shows a complex trend, leaning towards an uptrend.
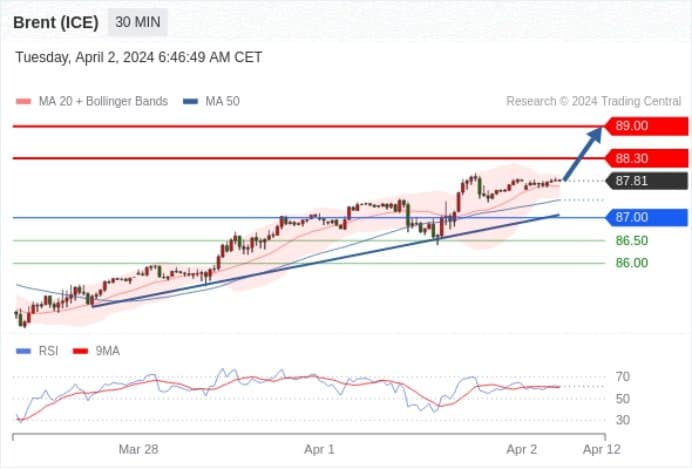
Brent Crude (ICE) (M4) Throughout the day: Heading towards 89.00.
Pivot point:
87.00
Trading strategy:
Bullish above 87.00, with target prices at 88.30, then 89.00.
Alternative strategy:
Bearish below 87.00, with target prices at 86.50, then 86.00.
Technical comments:
RSI indicator displays a further uptrend.
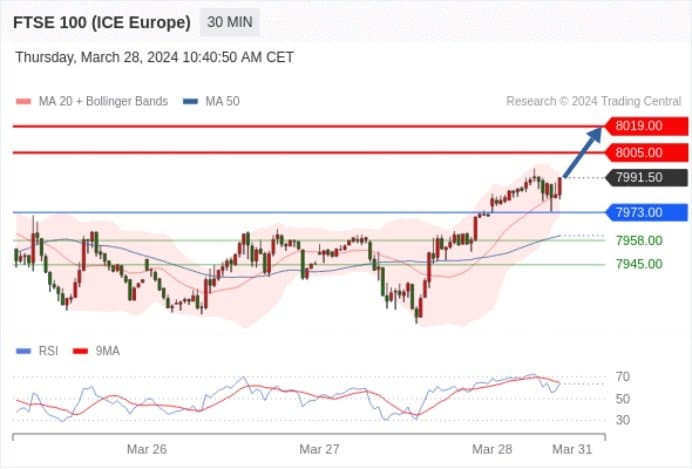
UK FTSE 100 Index Futures Throughout the day: Bullish above 7973.00.
Pivot point:
7973.00
Trading strategy:
Bullish above 7973.00, with target prices at 8005.00, then 8019.00.
Alternative strategy:
Bearish below 7973.00, with target prices at 7958.00, then 7945.00.
Technical comments:
RSI indicator points to a new upward trend.