View the market insights of the Global Research Department in the Trading Center today. Explore new trading methods and opportunities from popular trading products.
Euro/USD Pound/USD Spot Gold Euro/Yen Euro/Pound USD/Swiss Franc Germany DAX Index Futures (Eurex) Brent Crude (ICE) UK FTSE 100 Index Futures
Kind reminder: Due to market volatility, prices may have surpassed key points, rendering strategies ineffective.
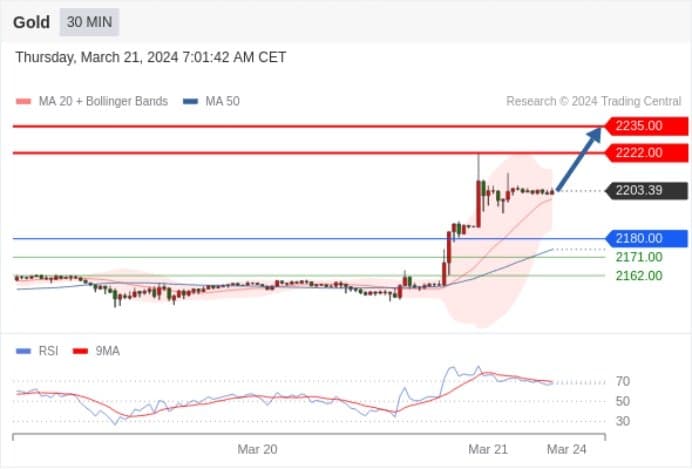
Spot Gold Within the day: Bullish above 2180.00.
Pivot point:
2180.00
Trading strategy:
Bullish above 2180.00, with target prices at 2222.00, followed by 2235.00.
Alternative strategy:
Bearish below 2180.00, with target prices at 2171.00, followed by 2162.00.
Technical commentary:
The RSI technical indicator shows a complex trend, inclined towards rising.
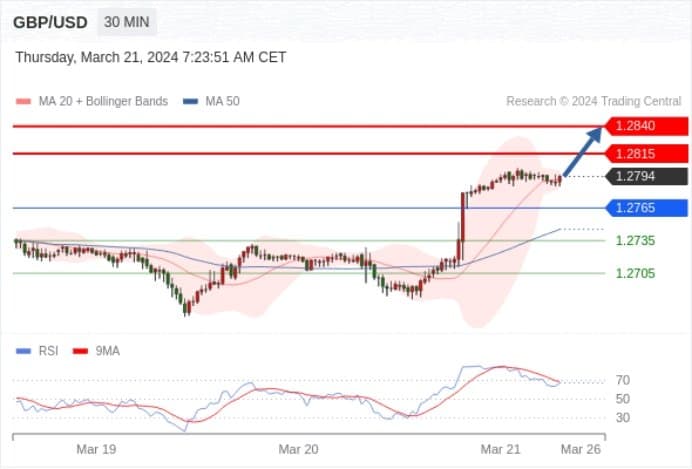
Pound/USD Within the day: Rising trend.
Pivot point:
1.2765
Trading strategy:
Bullish above 1.2765, with target prices at 1.2815, followed by 1.2840.
Alternative strategy:
Bearish below 1.2765, with target prices at 1.2735, followed by 1.2705.
Technical commentary:
The RSI technical indicator is on an upward trajectory.
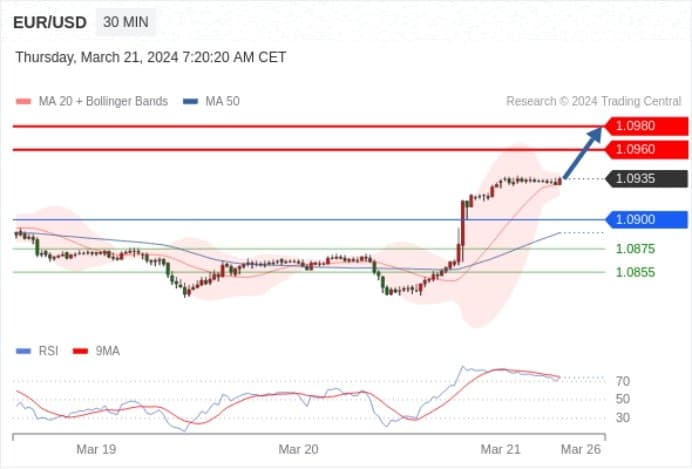
Euro/USD Within the day: Further rise.
Pivot point:
1.0900
Trading strategy:
Bullish above 1.0900, with target prices at 1.0960, followed by 1.0980.
Alternative strategy:
Bearish below 1.0900, with target prices at 1.0875, followed by 1.0855.
Technical commentary:
The RSI technical indicator is on an upward trajectory.
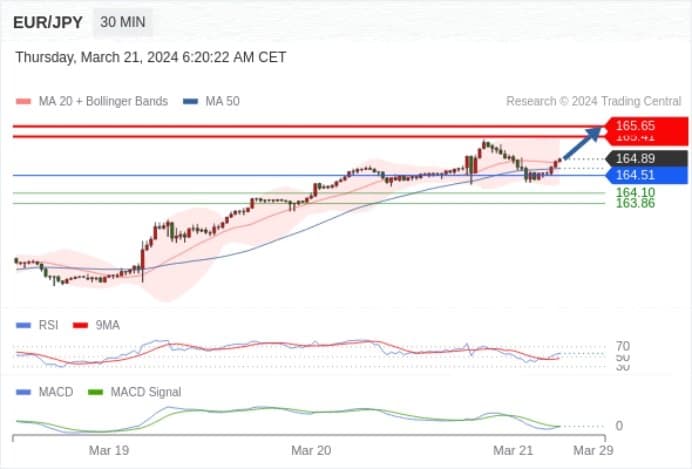
Euro/Yen Within the day: Bullish, with support at 164.51, targeting 165.65.
Pivot point set at:
164.51
Trading strategy:
Bullish, with support at 164.51, targeting 165.65.
Alternative strategy:
If it falls below 164.51, target direction set at 164.10 and 163.86.
Technical commentary:
The RSI technical indicator is above 50. The MACD technical indicator shows a bullish state and is below its signal line. Moreover, prices are above their 20-day and 50-day moving averages (currently at 164.82 and 164.68).
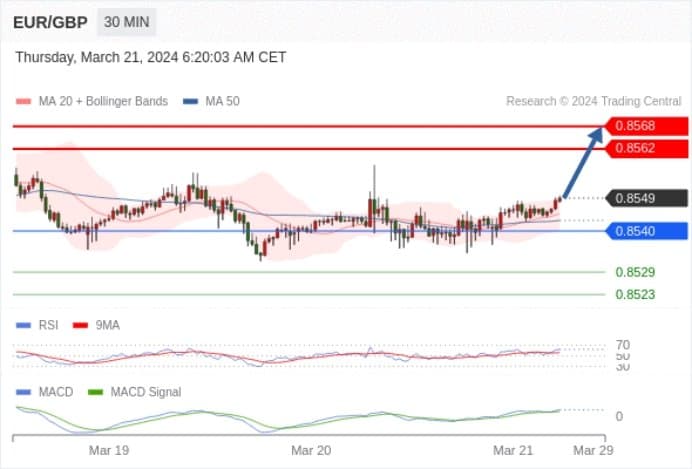
Euro/Pound Within the day: Bullish, with support at 0.8540.
0.8540 as the pivot point.
Trading strategy:
Bullish, with support at 0.8540.
Alternative strategy:
A downward breach of 0.8540 will bring a continuing downward trend, with target prices at 0.8529 followed by 0.8523.
Technical commentary:
The RSI technical indicator is above 50. The MACD technical indicator is bullish and above its signal line. In addition, prices are above their 20-day and 50-day moving averages (currently at 0.8545 and 0.8543).
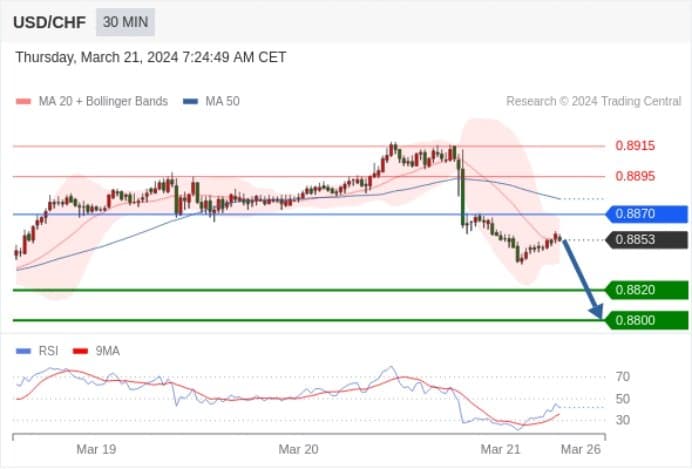
USD/Swiss Franc Within the day: Under pressure.
Pivot point:
0.8870
Trading strategy:
Bearish below 0.8870, with target prices at 0.8820, followed by 0.8800.
Alternative strategy:
Bullish above 0.8870, with target prices at 0.8895, followed by 0.8915.
Technical commentary:
As long as the resistance at 0.8870 is not breached, the risk of a drop below 0.8820 is high.
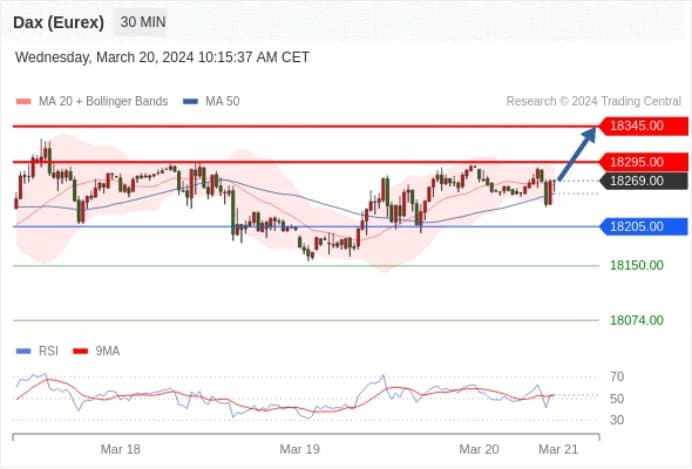
Germany DAX Index Futures (Eurex) (M4) Within the day: Bullish above 18205.00.
Pivot point:
18205.00
Trading strategy:
Bullish above 18205.00, with target prices at 18295.00, followed by 18345.00.
Alternative strategy:
Bearish below 18205.00, with target prices at 18150.00, followed by 18074.00.
Technical commentary:
The RSI technical indicator shows a complex trend, inclined towards rising.
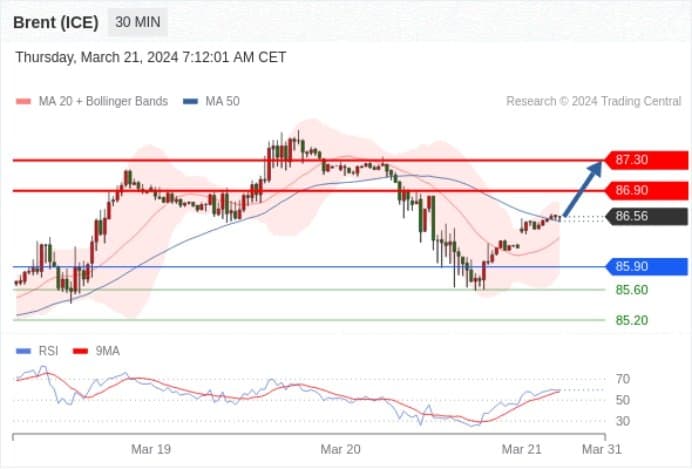
Brent Crude (ICE) (K4) Within the day: Rising.
Pivot point:
85.90
Trading strategy:
Bullish above 85.90, with target prices at 86.90, followed by 87.30.
Alternative strategy:
Bearish below 85.90, with target prices at 85.60, followed by 85.20.
Technical commentary:
The RSI technical indicator is bullish.
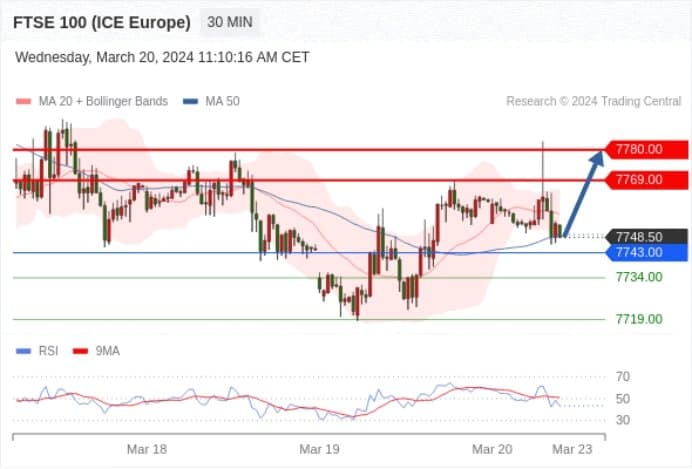
UK FTSE 100 Index Futures Within the day: Ultra-short-term (within the day) support near 7743.00.
Pivot point:
7743.00
Trading strategy:
Bullish above 7743.00, with target prices at 7769.00, followed by 7780.00.
Alternative strategy:
Bearish below 7743.00, with target prices at 7734.00, followed by 7719.00.
Technical commentary:
The RSI technical indicator shows a complex trend, proceed with caution.