Check out today's market views from the global research department at the Trading Center. Explore new trading methods and opportunities from popular trading products.
EUR/USD GBP/USD Spot Gold EUR/JPY EUR/GBP USD/CHF German DAX Index Futures (Eurex) Brent Crude (ICE) UK FTSE 100 Index Futures
Friendly Reminder: Due to market volatility, prices may have crossed key points, rendering strategies ineffective.
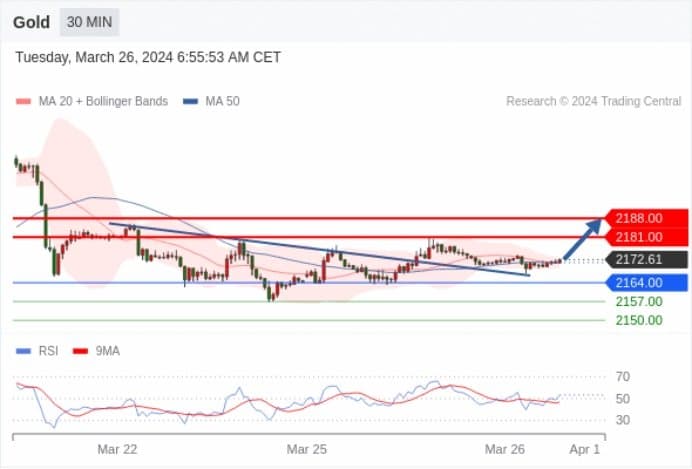
Spot Gold For intra-day: Ultra short-term (within the day) support is around 2164.00.
Pivot point:
2164.00
Trading strategy:
Above 2164.00, bullish, target prices at 2181.00, then at 2188.00.
Alternative strategy:
Below 2164.00, bearish, target prices at 2157.00, then at 2150.00.
Technical comment:
RSI shows an uptrend.
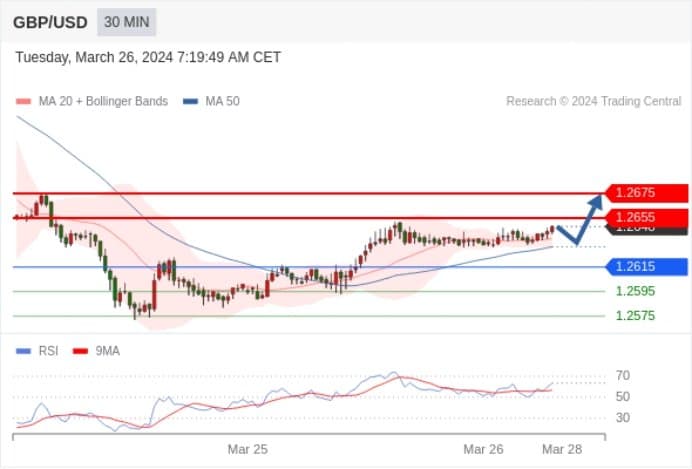
GBP/USD intra-day: bullish.
Pivot point:
1.2615
Trading strategy:
Above 1.2615, bullish, target prices at 1.2655, then at 1.2675.
Alternative strategy:
Below 1.2615, bearish, target prices at 1.2595, then at 1.2575.
Technical comment:
RSI indicator is trending upwards.
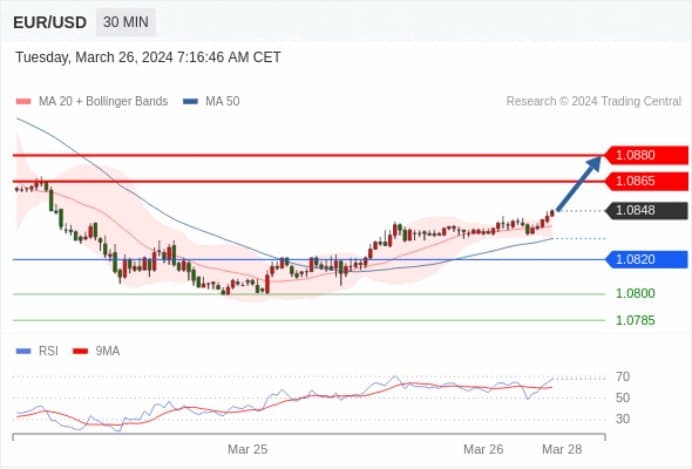
EUR/USD intra-day: An upward trend.
Pivot point:
1.0820
Trading strategy:
Above 1.0820, bullish, target prices at 1.0865, then at 1.0880.
Alternative strategy:
Below 1.0820, bearish, target prices at 1.0800, then at 1.0785.
Technical comment:
RSI indicator is trending upwards.
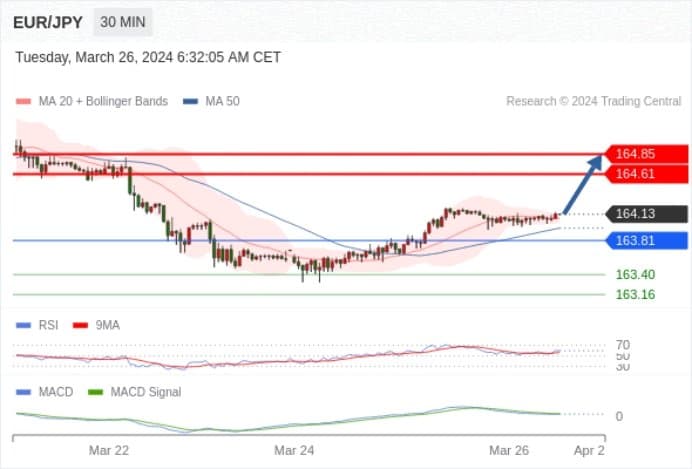
EUR/JPY intra-day: Bullish, with 163.81 as the support level, target set at 164.85.
163.81 as the pivot point.
Trading strategy:
Bullish, with 163.81 as the support level, target set at 164.85.
Alternative strategy:
If it falls below 163.81, EUR/JPY target direction set at 163.40 and 163.16.
Technical comment:
RSI technical indicator above the neutral zone of 50. MACD is bullish as it is below its signal line. Additionally, the price is above its 20-day and 50-day moving averages (currently at 164.08 and 163.96).
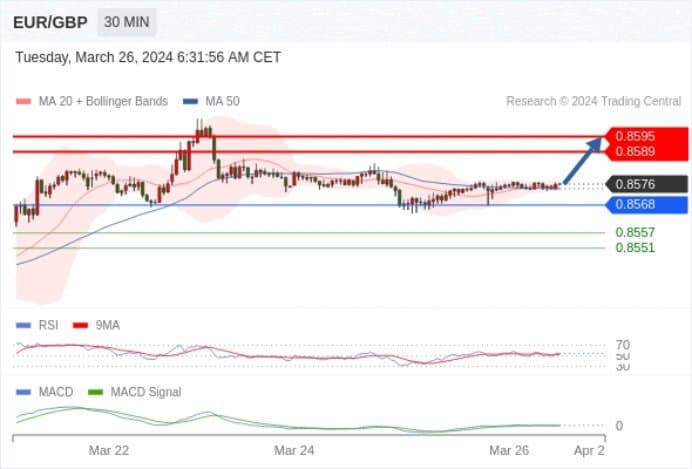
EUR/GBP intra-day: Bullish, with 0.8568 as the support level.
Pivot point set at:
0.8568
Trading strategy:
Bullish, with 0.8568 as the support level.
Alternative strategy:
If it falls below 0.8568, EUR/GBP target direction set at 0.8557 and 0.8551.
Technical comment:
RSI indicator above the neutral zone of 50. MACD is bullish and above its signal line. Additionally, the price is above its 20-day and 50-day moving averages (currently at 0.8575 and 0.8574).
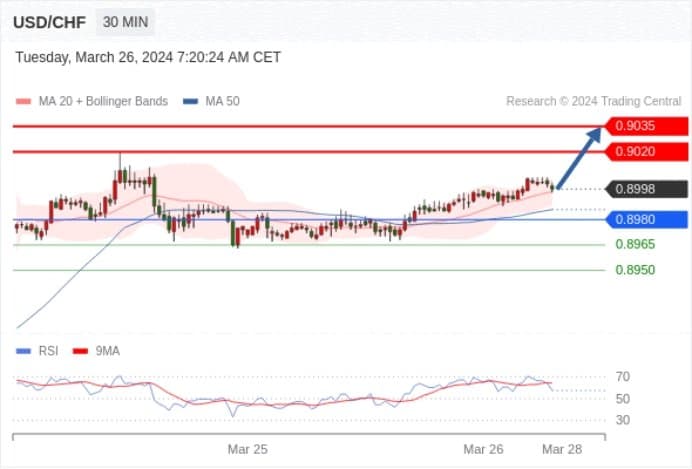
USD/CHF intra-day: An uptrend.
Pivot point:
0.8980
Trading strategy:
Above 0.8980, bullish, target prices at 0.9020, then at 0.9035.
Alternative strategy:
Below 0.8980, bearish, target prices at 0.8965, then at 0.8950.
Technical comment:
RSI indicator shows a complex trend, leaning towards rising.
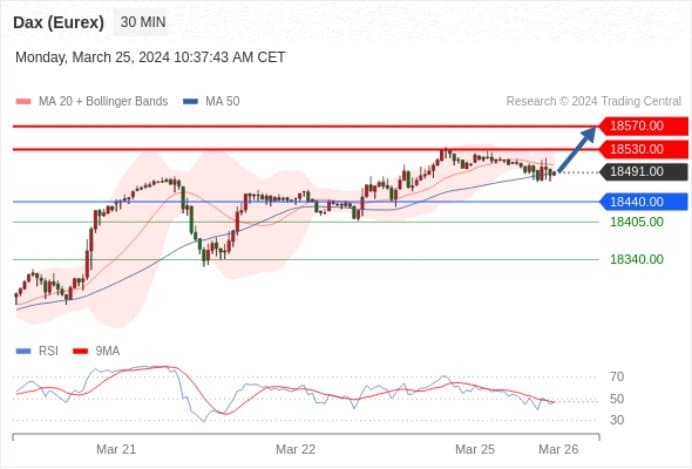
German DAX Index Futures (Eurex) (M4) intra-day: Bullish above 18440.00.
Pivot point:
18440.00
Trading strategy:
Above 18440.00, bullish, target prices at 18530.00, then at 18570.00.
Alternative strategy:
Below 18440.00, bearish, target prices at 18405.00, then at 18340.00.
Technical comment:
RSI indicator shows a complex trend, proceed with caution.
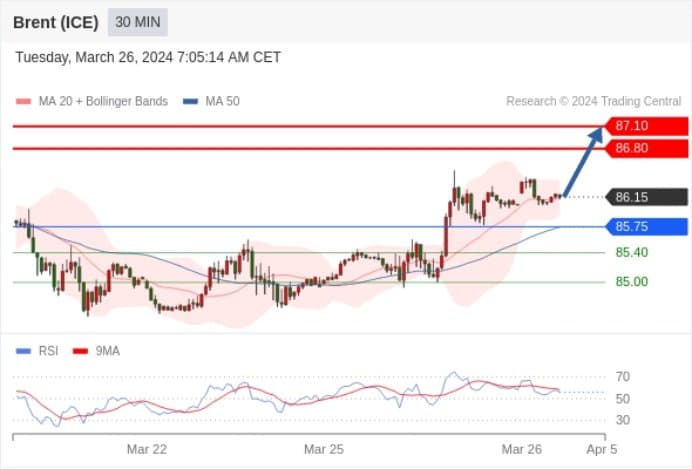
Brent Crude Oil (ICE) (M4) intra-day: Bullish above 85.75.
Pivot point:
85.75
Trading strategy:
Above 85.75, bullish, target prices at 86.80, then at 87.10.
Alternative strategy:
Below 85.75, bearish, target prices at 85.40, then at 85.00.
Technical comment:
RSI indicator shows a complex trend, leaning towards rising.
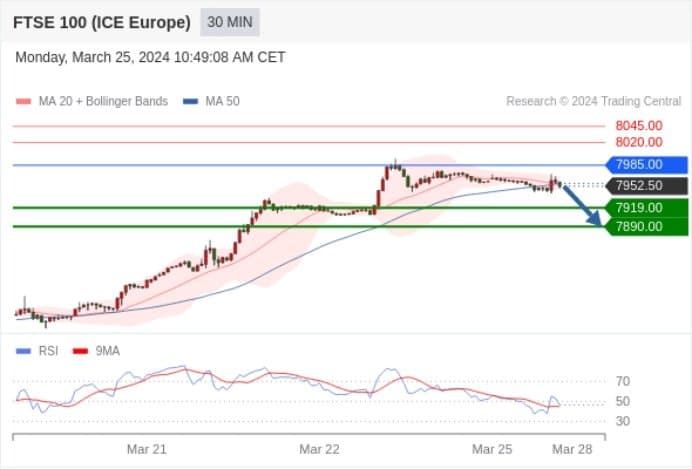
UK FTSE 100 Index Futures intra-day: A short-term adjustment.
Pivot point:
7985.00
Trading strategy:
Below 7985.00, bearish, target prices at 7919.00, then at 7890.00.
Alternative strategy:
Above 7985.00, bullish, target prices at 8020.00, then at 8045.00.
Technical comment:
RSI indicator is below the 50% neutral zone.