View the global market opinions of the Trading Center's Global Research Department today. Explore new trading methods and opportunities from popular trading products.
EUR/USD, Gold Spot, GBP/USD, EUR/JPY, EUR/GBP, USD/CHF, Germany DAX Futures (Eurex), Brent Crude Oil (ICE), UK FTSE 100 Index Futures
Friendly reminder: Due to market fluctuations, prices may have crossed key levels, rendering strategies ineffective.
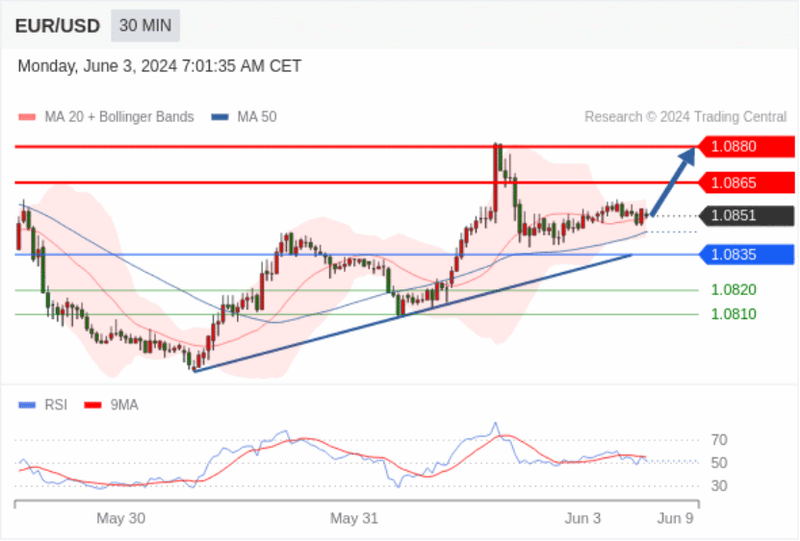
EUR/USD Intraday: Ultra-short-term support around 1.0835.
Pivot Point:
1.0835
Trading Strategy:
Above 1.0835, look for a rise towards 1.0865, then 1.0880.
Alternative Strategy:
Below 1.0835, look for a decline towards 1.0820, then 1.0810.
Technical Analysis:
The RSI technical indicator shows a complex trend, leaning towards an upward movement.
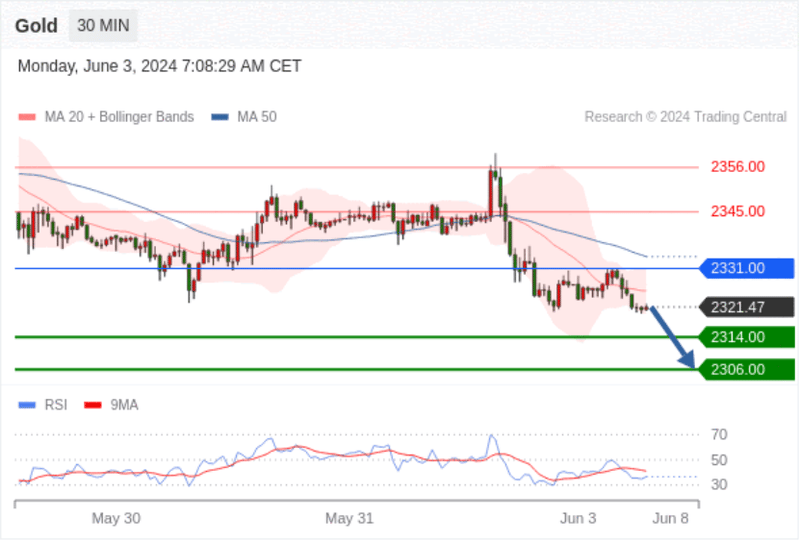
Gold Spot Intraday: Moving towards 2306.00.
Pivot Point:
2331.00
Trading Strategy:
Below 2331.00, look for a drop towards 2314.00, then 2306.00.
Alternative Strategy:
Above 2331.00, look for a rise towards 2345.00, then 2356.00.
Technical Analysis:
The RSI technical indicator shows a complex trend, leaning towards a downward movement.
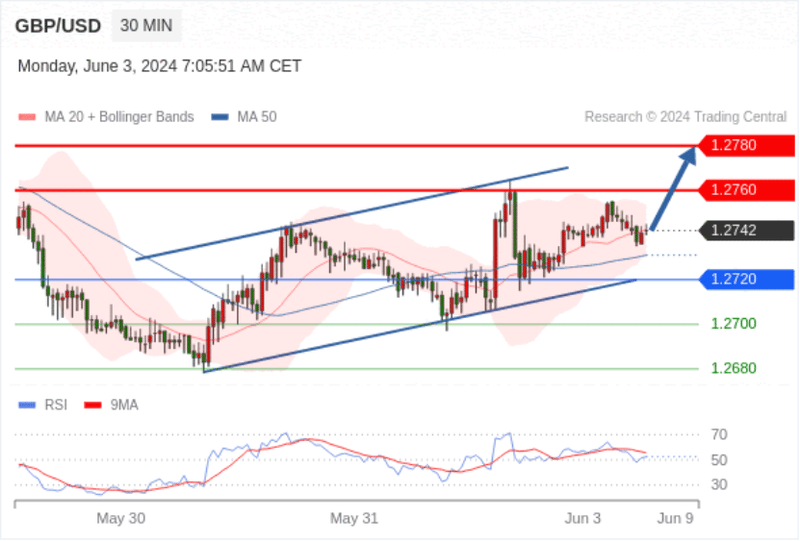
GBP/USD Intraday: Bullish above 1.2720.
Pivot Point:
1.2720
Trading Strategy:
Above 1.2720, look for a rise towards 1.2760, then 1.2780.
Alternative Strategy:
Below 1.2720, look for a decline towards 1.2700, then 1.2680.
Technical Analysis:
Even though a continuous correction cannot be ruled out, its duration should be limited.
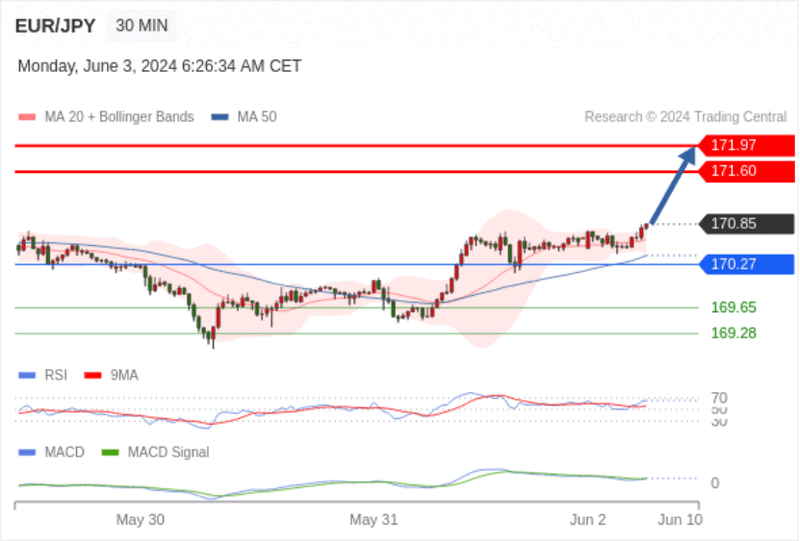
EUR/JPY Intraday: Bullish while 170.27 serves as support.
Pivot Point: 170.27
Trading Strategy:
Bullish while 170.27 serves as support.
Alternative Strategy:
If it breaks below 170.27, the EUR/JPY target direction is set at 169.65 and 169.28.
Technical Analysis:
The RSI technical indicator is above the neutral area of 50. The MACD technical indicator is above its signal line, indicating a bullish stance. Additionally, the price is above its 20-day and 50-day moving averages (at 170.62 and 170.40, respectively). Lastly, the current price is above the upper Bollinger band (at 170.81).
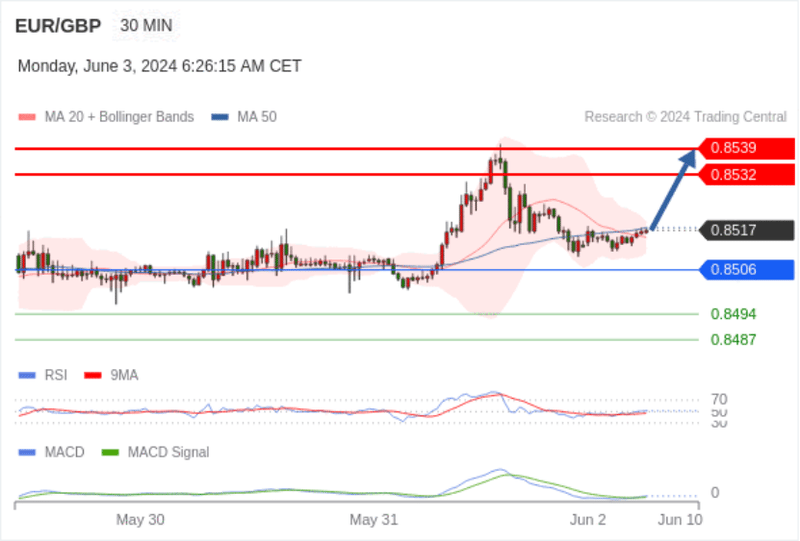
EUR/GBP Intraday: Bullish.
Pivot Point:
0.8506
Trading Strategy:
Bullish.
Alternative Strategy:
A break below 0.8506 will likely initiate a further decline to 0.8494, then 0.8487.
Technical Analysis:
The RSI technical indicator is above 50. The MACD technical indicator shows a bearish state but is above its signal line. Additionally, the price is below its 50-day moving average (0.8518) but above its 20-day moving average (0.8515).
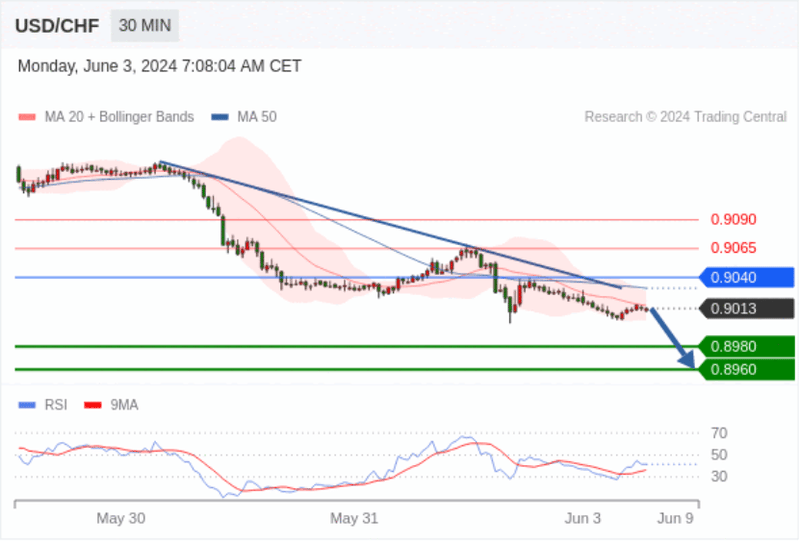
USD/CHF Intraday: Short-term key resistance at 0.9040.
Pivot Point:
0.9040
Trading Strategy:
Below 0.9040, look for a drop towards 0.8980, then 0.8960.
Alternative Strategy:
Above 0.9040, look for a rise towards 0.9065, then 0.9090.
Technical Analysis:
As long as the resistance at 0.9040 holds, there is a bearish bias in price movement.
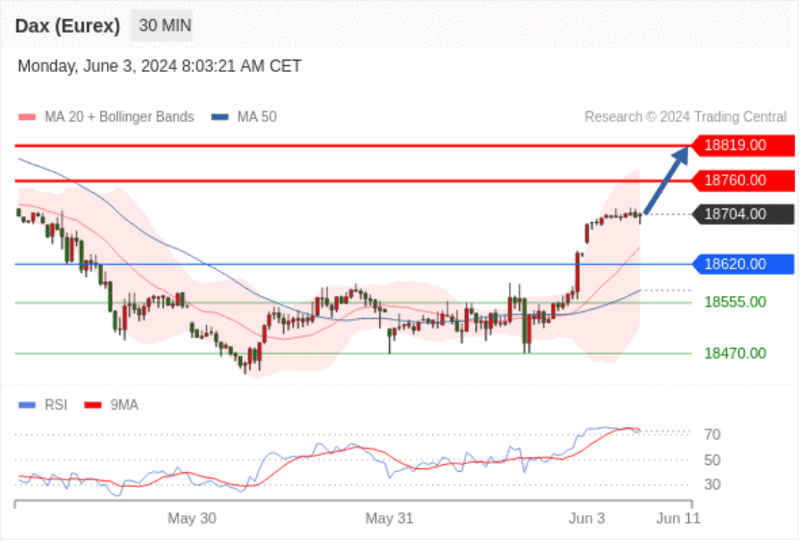
Germany DAX Futures (Eurex) Intraday: Ultra-short-term support around 18620.00.
Pivot Point:
18620.00
Trading Strategy:
Above 18620.00, look for a rise towards 18760.00, then 18819.00.
Alternative Strategy:
Below 18620.00, look for a decline towards 18555.00, then 18470.00.
Technical Analysis:
Investors should proceed with caution as these support or resistance levels might trigger profit-taking.
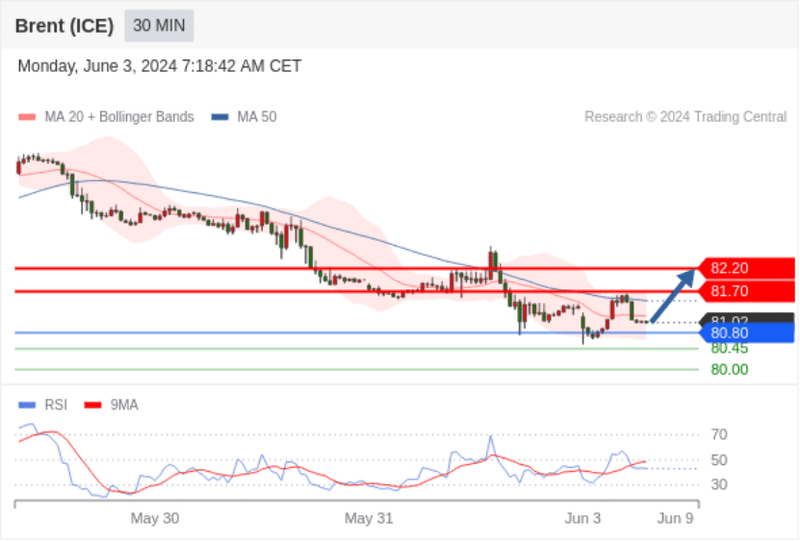
Brent Crude Oil (ICE) Intraday: Ultra-short-term support around 80.80.
Pivot Point:
80.80
Trading Strategy:
Above 80.80, look for a rise towards 81.70, then 82.20.
Alternative Strategy:
Below 80.80, look for a decline towards 80.45, then 80.00.
Technical Analysis:
The RSI technical indicator shows a complex trend, leaning towards an upward movement.
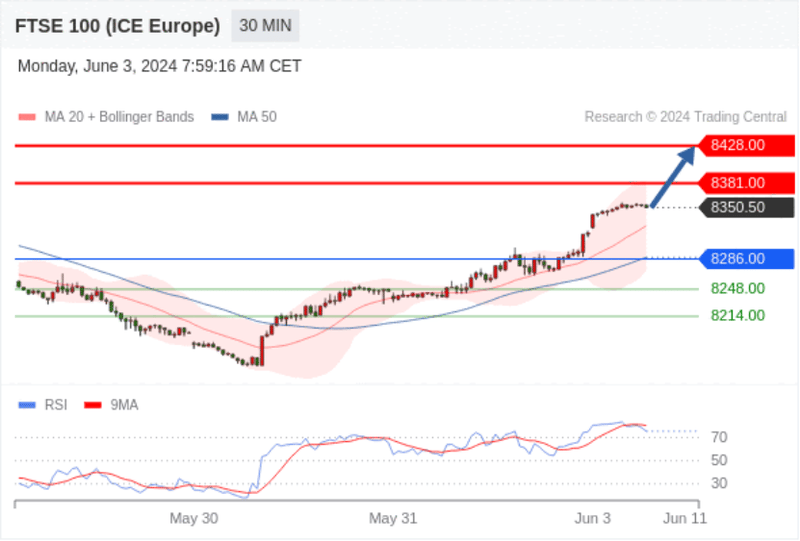
UK FTSE 100 Futures Intraday: Limited upside potential.
Pivot Point:
8286.00
Trading Strategy:
Above 8286.00, look for a rise towards 8381.00, then 8428.00.
Alternative Strategy:
Below 8286.00, look for a decline towards 8248.00, then 8214.00.
Technical Analysis:
Investors should proceed with caution as these support or resistance levels might trigger profit-taking.