Nasdaq 100 Index: No Correction Yet
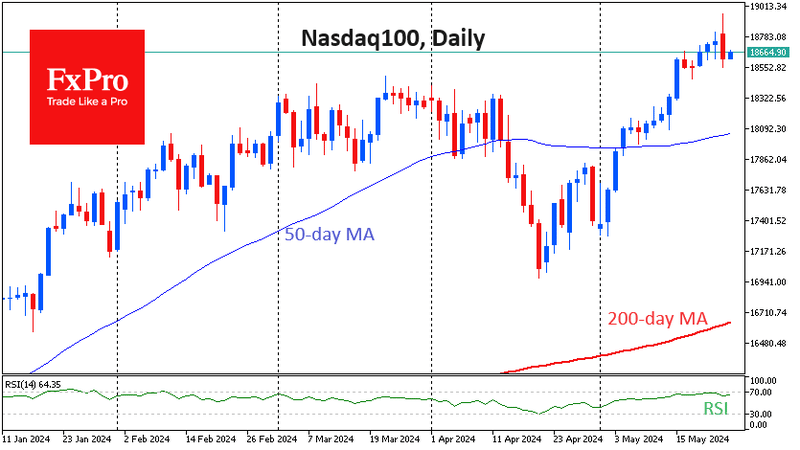
The Nasdaq 100 index once again became the main driver of U.S. stock index growth in May, indirectly having a positive impact on other markets. On Thursday, the index approached 19,000 points, rising more than 11% from its low on April 19. An impressive wave of selling hit the market, causing the index to drop 2% from its peak to its lowest point. The question now is whether we are seeing the beginning of a long-term pullback?
FxPro Senior Analyst Alex Kuptsikevich noted: Technically, the Nasdaq 100 index is in the RSI overbought zone on the daily time frame. Although it is not easy to predict, entering this area is more likely to see the most aggressive growth. The fact that the index is currently only 1% higher than the previous peak supports buyer interest. After the peak, a correction occurred in April, eliminating most of the short-term overheating.
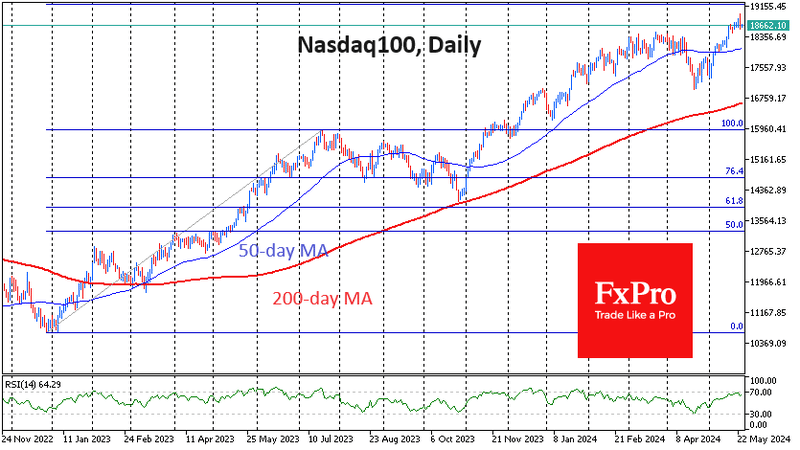
Last year's pullback from July to October followed the classic Fibonacci pattern, bringing the Nasdaq 100 index close to 61.8% of its initial rise, just one step away from the 200-day moving average. This is usually followed by a rebound to 161.8%, around 19,200 points.
Therefore, the Nasdaq 100 index lacks a significant resistance area. However, it is very likely that it is merely pausing before the next surge to consolidate its strength.
However, without a sharp change in market sentiment or a drastic deterioration in economic data, we should not expect the stock index to steadily decline. The last downward impulse was triggered by short-term profit-taking in response to a new round of strong macroeconomic data. These data suggest tightening monetary policy, but this is not a sufficient reason to trigger a bear market.
However, it is worth noting that a break below the previous consolidation top near 18,300 points could be an important technical signal of a trend reversal.