• Home
  • Categories
  • News
  • Community
EN
EN
Home
CategoriesNewsGlossaryCommunityAbout Us
Contact Us
Social Media
Region
🌏International
Region
🌏International

Copyright © 2023-2026 Traderknows Ltd. All rights reserved.

Contact
Home
/
News
/
FxPro Analysis: The S&P 500's Weak Growth May Persist for Several Months

FxPro Analysis: The S&P 500's Weak Growth May Persist for Several Months

FxProFxPro
2024-04-01
Summary:FxPro Analysis: The S&P 500's Weak Growth May Persist for Several Months

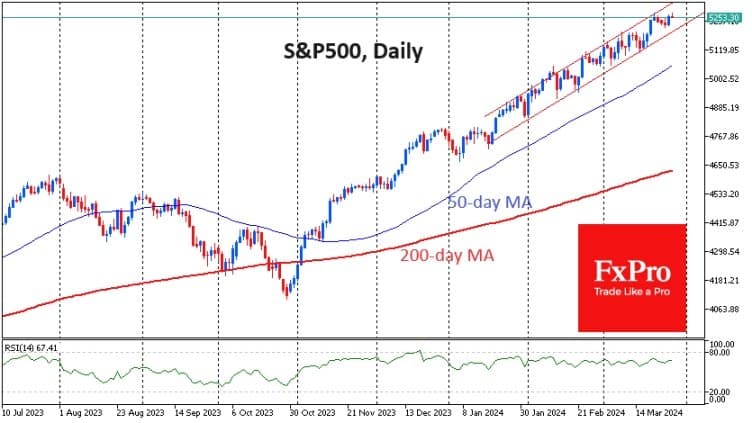
The American stock market continues to show an upward trend, with the S&P 500 index rising by 10.8% in the first quarter, surpassing the historical average annual gain. Since the end of January, the low volatility of this index has been particularly impressive.

Alex Kuptsikevich, a senior analyst at FxPro, notes: "The volatility of the S&P 500 index is less than 2.5%. The market's frequent slight pullbacks lay the groundwork for further buying. This type of rebound is common in mature bull markets, which have enough momentum to move away from the bottom but are not yet striving to move higher."

65132a96-3f54-433a-8126-a1b2596c06b8

Equally important, the current rally is becoming increasingly broad-based. The seven giants are disintegrating, with Apple and Tesla clearly taking hits, but more stocks are maintaining a growth trend. The popular index—the Russell 2000—broke through its highest level since January 2022 on Thursday. However, from April 2022 to February 2024, the index was in a sideways trade. This is an important sign of the overall health of the stock market, not just a popular investment phrase.

4ae60fd8-ea69-42a3-b46c-482d84ad290a

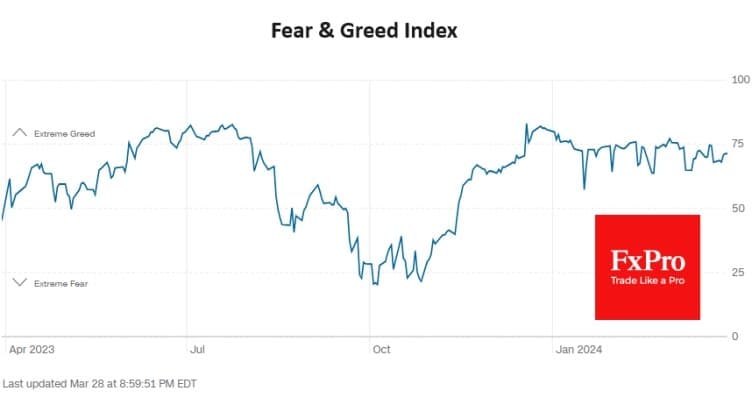
In the four months since the latter half of December, CNN's Fear and Greed Index has hovered near "Extreme Greed", although most of the time, it was just slightly below this line. It's very close to the edge, with a solid bullish trend, but without market overheating, so there is no need to release momentum.

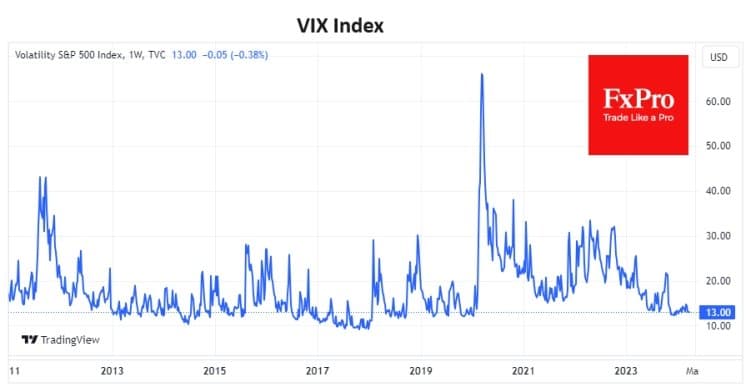
The VIX Volatility Index is currently at levels typical for most of 2018 and 2019, with the upward trend nearing an end. In 2017, the VIX index was below its current level for the entire year, so calling it an anomaly would be unfair.

2c0e25b2-2ec4-468d-8179-bcd4feadca75

Similar amplitude dynamics in the S&P 500 index were also seen from August 2017 to January 2018, from April to September 2018, and from October 2019 to February 2020. These periods lasted between four to six months, but economic growth was interrupted due to changes in the external environment from trade wars to pandemics.

b202c369-c349-4fbb-9248-c77793010bf6

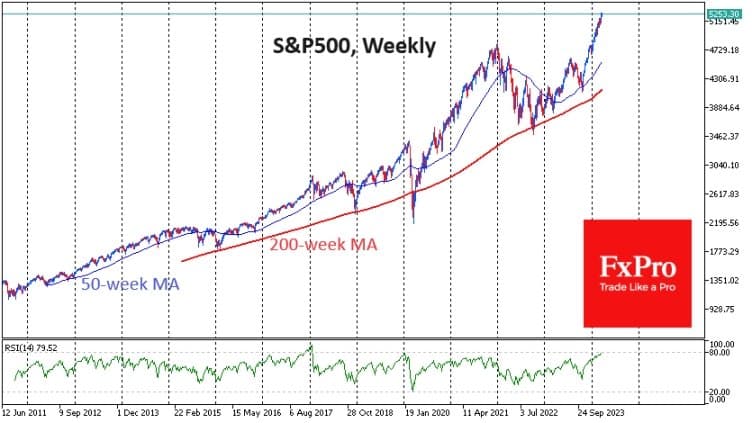
On a weekly timeframe, the RSI is close to 80, a strong overbought area. When it reached this level in January 2020, it formed a strong bearish sentiment, and we saw a minor adjustment even before concerns about the pandemic. But there's another example: from November 2017 to January 2018, the Relative Strength Index exceeded 80, and the S&P 500 index rose by more than 9%, reaching its peak.

In summary, the rise of the S&P 500 index does not seem excessive. The market is not overheating, nor will it collapse under its own pressure. However, investors should be aware of any external environment that could harm the economy because stock indices could quickly correct stock expectations and trigger a deep adjustment.

Risk Warning and Disclaimer

The market carries risks, and investment should be cautious. This article does not constitute personal investment advice and has not taken into account individual users' specific investment goals, financial situations, or needs. Users should consider whether any opinions, viewpoints, or conclusions in this article are suitable for their particular circumstances. Investing based on this is at one's own responsibility.

The End
Previous
Next
Comments
0/1000
FxPro
Written byFxPro
Created date:2024-04-01 06:43
Last Updated:2024-04-01 07:37
Wiki
Stock Market Volatility

Stock market volatility is an indicator measuring the fluctuation of stock prices, and it holds significant value for investors and traders in devising risk management strategies and predicting market trends.

Organization

Active

FxProFxPro
Recent Post

Trump Invokes Defense Production Act with 850 Million USD for Coal Power to Meet AI Demand

2 hours ago

NY Fed Index Shows High Supply Chain Pressures as Geopolitical Conflicts Raise Global Inflation Con…

2 hours ago

Japan's Real Wages Rise for Fourth Consecutive Month, Fueling June BOJ Rate Hike Bets

2 hours ago

China Flexible Employment Exceeds 300 Million as Blue-Collar Wage Growth Outpaces White-Collar for…

2 hours ago

South Korean Stocks Post Steepest Weekly Drop Since March as Tech Valuations Reset

2 hours ago

China Commercial Paper Rates Drop in Early June Amid Rising Bank Demand

2 hours ago

UK House Prices Unexpectedly Fall in May as Geopolitical Tensions Push Up Borrowing Costs

2 hours ago

Massive Intervention Fails to Save Yen as Short Positions Surge Near Historic Lows

2 hours ago

AI Momentum Pauses as Broadcom Outlook Misses High Expectations; Markets Await Payrolls

2 hours ago

SpaceX Launches 75B USD IPO Roadshow as Access Blocked in Mainland China and Hong Kong

2 hours ago

Global Gold ETFs See $2 Billion Outflows in May as Capital Pivots to Tech Assets

2 hours ago

Nikkei Drops Over 1% on Tech Sector Pullback While Real Wage Growth Provides Support

2 hours ago

South Korea Lifts Mandatory Reporting for Crypto Transfers Over 10M Won

2 hours ago

Amundi Says Asian AI Stocks Supported by Fundamentals as Fed Path Poses Key Risk

2 hours ago

Taiwan Stocks Close 1.33% Lower on Broadcom Drop But Hold Key Technical Support

2 hours ago

Risk Warning

TraderKnows is a financial media platform, with information displayed coming from public networks or uploaded by users. TraderKnows does not endorse any trading platform or variety. We bear no responsibility for any trading disputes or losses arising from the use of this information. Please be aware that displayed information may be delayed, and users should independently verify it to ensure its accuracy.