Check out today's market insights from the Global Research Department at the Trading Center. Explore new trading methods and opportunities from popular trading products.
EUR/USD GBP/USD Spot Gold EUR/JPY EUR/GBP USD/CHF Germany DAX Index Futures (Eurex) Brent Crude (ICE) UK FTSE 100 Index Futures
Reminder: Due to market volatility, prices may have moved past key levels, rendering strategies ineffective.
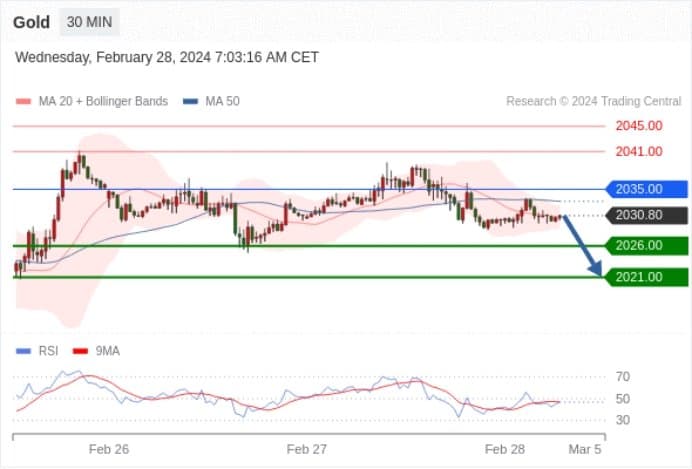
Spot Gold Today: No apparent trend.
Pivot Point:
2035.00
Trading Strategy:
Below 2035.00, bearish with target prices at 2026.00, then 2021.00.
Alternative Strategy:
Above 2035.00, bullish with target prices at 2041.00, then 2045.00.
Technical Commentary:
The RSI indicator is below the 50% neutral zone.
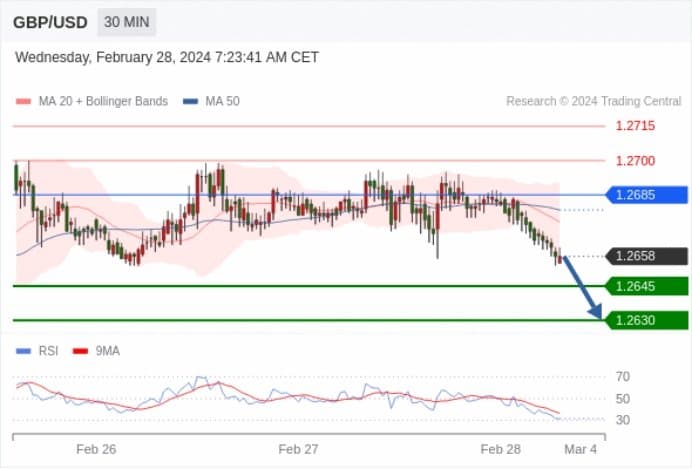
GBP/USD Today: Under pressure.
Pivot Point:
1.2685
Trading Strategy:
Below 1.2685, bearish with target prices at 1.2645, then 1.2630.
Alternative Strategy:
Above 1.2685, bullish with target prices at 1.2700, then 1.2715.
Technical Commentary:
The RSI indicator is trending downwards.
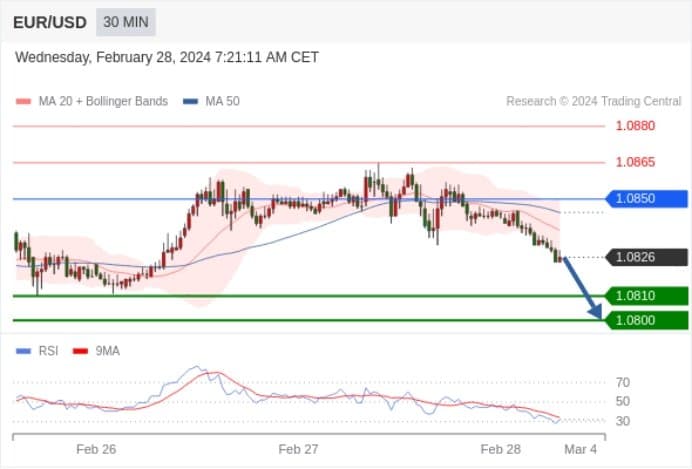
EUR/USD Today: Under pressure.
Pivot Point:
1.0850
Trading Strategy:
Below 1.0850, bearish with target prices at 1.0810, then 1.0800.
Alternative Strategy:
Above 1.0850, bullish with target prices at 1.0865, then 1.0880.
Technical Commentary:
The RSI indicator is trending downwards.
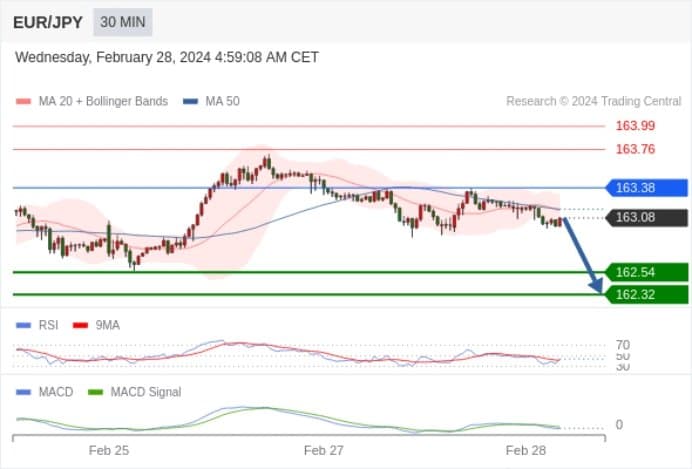
EUR/JPY Today: Bearish, below 163.38.
163.38 as the pivot point.
Trading Strategy:
Bearish, below 163.38.
Alternative Strategy:
If it breaks through 163.38, EUR/JPY targets are 163.76 and 163.99.
Technical Commentary:
The RSI indicator is below the neutral 50 zone. The MACD indicator is bearish, below its signal line. Additionally, the price is below its 20-day and 50-day moving averages (currently at 163.16 and 163.17).
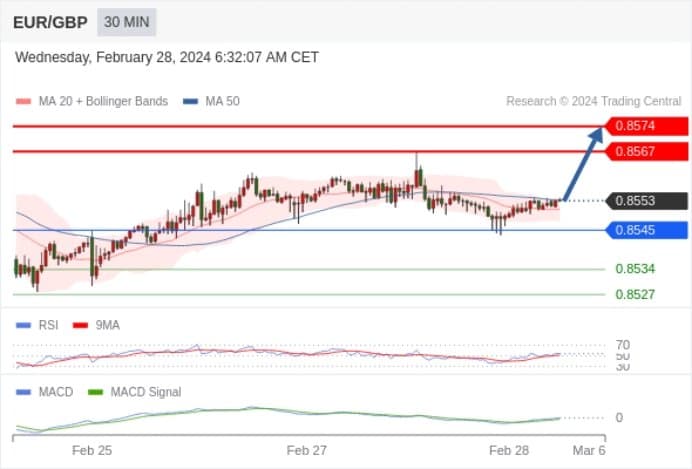
EUR/GBP Today: Bullish.
0.8545 as the pivot point.
Trading Strategy:
Bullish.
Alternative Strategy:
If it falls below 0.8545, EUR/GBP targets are 0.8534 and 0.8527.
Technical Commentary:
The RSI indicator is above the neutral 50 zone. The MACD indicator is bearish but above its signal line. Additionally, the price is below its 50-day moving average (0.8553) but above the 20-day moving average (0.8551).
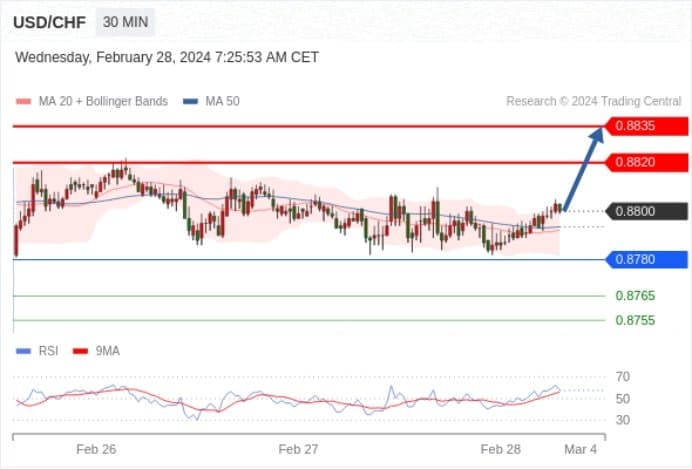
USD/CHF Today: Uptrend.
Pivot Point:
0.8780
Trading Strategy:
Above 0.8780, bullish with target prices at 0.8820, then 0.8835.
Alternative Strategy:
Below 0.8780, bearish, with target prices at 0.8765, then 0.8755.
Technical Commentary:
The RSI indicator is trending upwards.
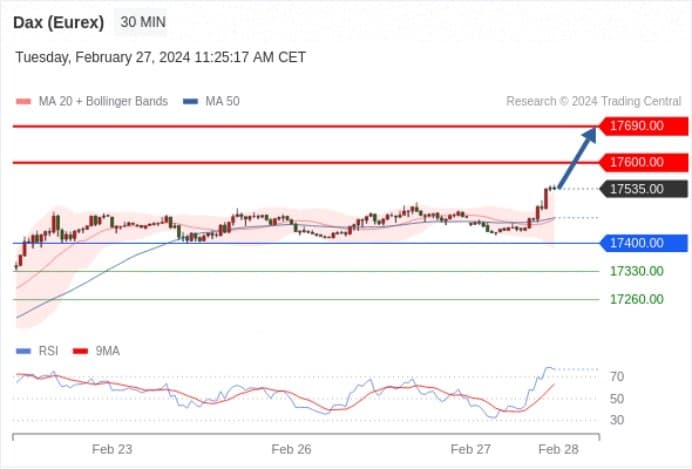
Germany DAX Index Futures (Eurex) (H4): A new round of rising.
Pivot Point:
17400.00
Trading Strategy:
Above 17400.00, bullish with target prices at 17600.00, then 17690.00.
Alternative Strategy:
Below 17400.00, bearish, with target prices at 17330.00, then 17260.00.
Technical Commentary:
The RSI indicator is bullish, indicating a potential further uptrend.
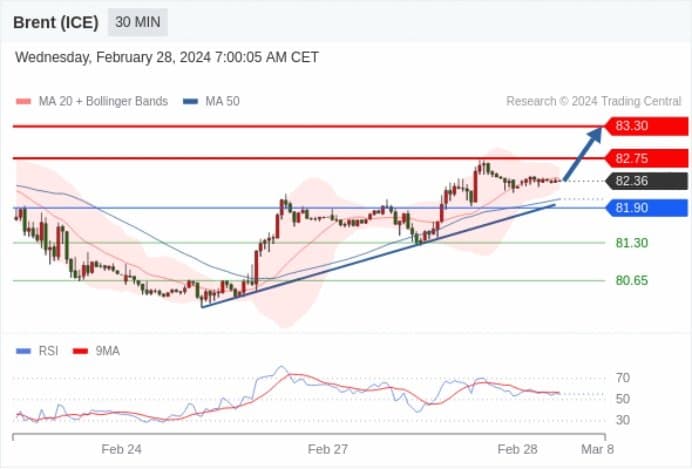
Brent Crude (ICE) (K4): Bullish today.
Pivot Point:
81.90
Trading Strategy:
Above 81.90, bullish with target prices at 82.75, then 83.30.
Alternative Strategy:
Below 81.90, bearish, with target prices at 81.30, then 80.65.
Technical Commentary:
The RSI indicator shows a complex trend, leaning towards rising.
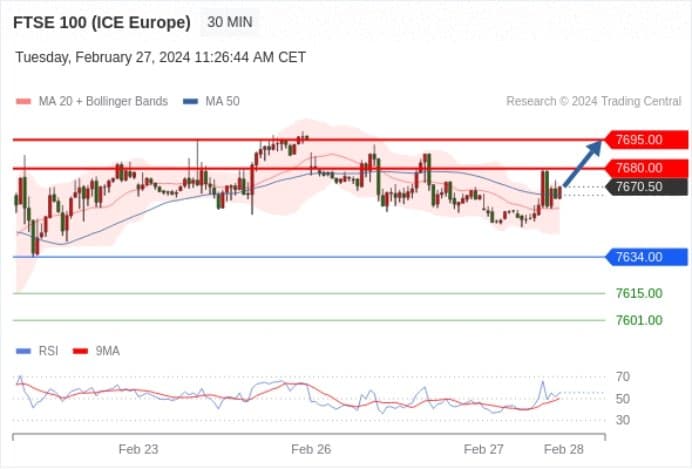
UK FTSE 100 Index Futures Today: Bullish, above 7634.00.
Pivot Point:
7634.00
Trading Strategy:
Above 7634.00, bullish with target prices at 7680.00, then 7695.00.
Alternative Strategy:
Below 7634.00, bearish, with target prices at 7615.00, then 7601.00.
Technical Commentary:
Even though we can't rule out the possibility of ongoing adjustments, their duration should be limited.