Oil prices have dropped to their lowest level since the end of March, nearing a critical support level.
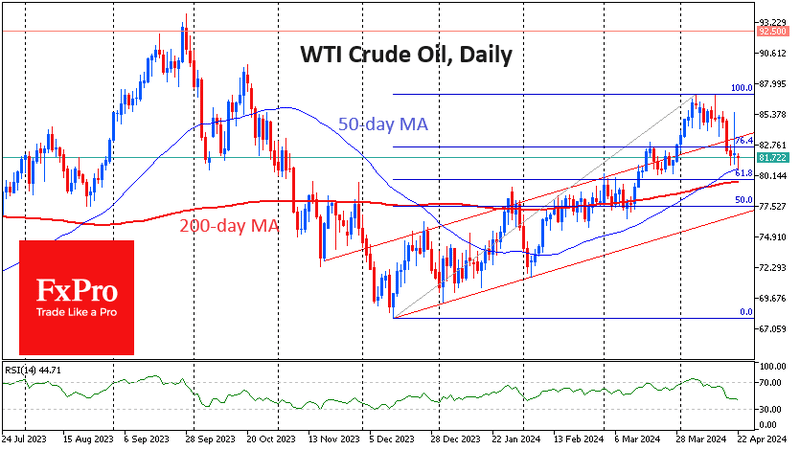
The price of WTI crude fell to $80.60 in Monday morning trading. A month ago, the price found support in the $80.0- $80.50 range, then accelerated higher breaking through the resistance of the upward channel. Last week's sell-off pushed the price back into this range.
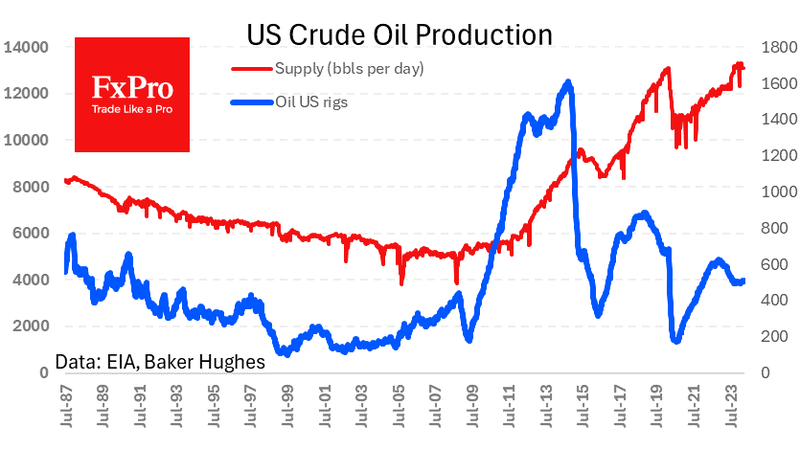
FxPro senior analyst Alex Kuptsikevich noted: The macroeconomic background is unfavorable for bulls: U.S. oil inventories are rising, the number of oil drilling rigs has reached its highest level since September last year, and the International Monetary Fund (IMF) expects OPEC+ quotas to start increasing from mid-year. The dollar is strengthening, and stock indices are falling, which adds pressure on oil prices.
Oil prices are testing the 50-day moving average (currently at $80.60 per barrel). A January closing price above this level triggered a three-month rally.
The 200-day moving average is just below $79.60, less than a dollar away. Breaking below this index could signify a change in the long-term trend. Over the past two years, the market has seen significant volatility upon touching the 200-day average: either decisively breaking through it or rebounding sharply.
Recently, the 200-day moving average coincides with the 61.8% Fibonacci retracement level from the December low to the April high. If oil prices drop below $70 per barrel, it would mean a resumption of the long-term downtrend, pulling prices back to cyclical lows. If it manages to stay above the 200-day moving average, it means the Fibonacci level will extend, with potential upside targets near $100.
Therefore, the oil price trend in the coming days is worth watching by traders and investors, as it will determine the long-term trend.