Check the market views of the global research department at the trading center today. Explore new trading methods and opportunities among popular trading products.
EUR/USD Gold GBP/USD EUR/JPY EUR/GBP USD/CHF German DAX Futures (Eurex) Brent Crude Oil (ICE) UK FTSE 100 Futures
Friendly reminder: Due to market volatility, prices may have crossed key points, rendering strategies ineffective.
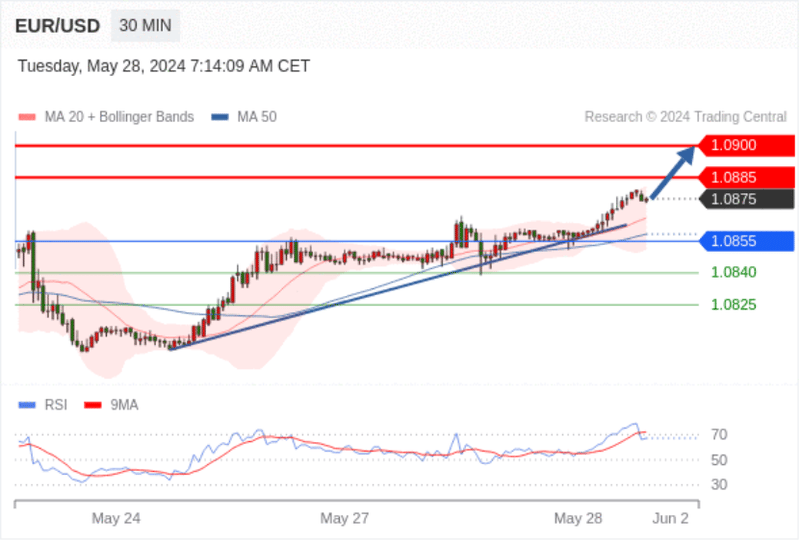
EUR/USD Intraday: Further upward movement.
Pivot point:
1.0855
Trading strategy:
Above 1.0855, bullish, target price at 1.0885, then 1.0900.
Alternative strategy:
Below 1.0855, bearish, target price set at 1.0840, then 1.0825.
Technical comment:
Above 1.0855 is a bullish signal, with an upward target of 1.0885.
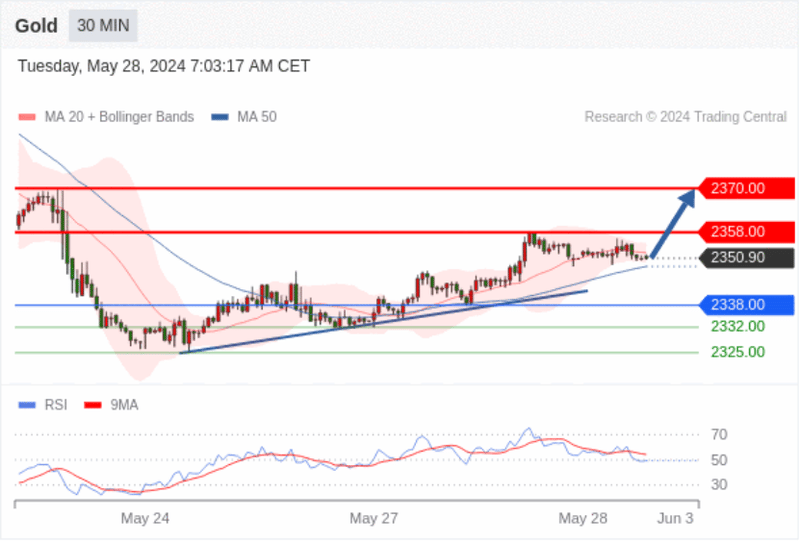
Gold Intraday: Bullish above 2338.00.
Pivot point:
2338.00
Trading strategy:
Above 2338.00, bullish, target price at 2358.00, then 2370.00.
Alternative strategy:
Below 2338.00, bearish, target price set at 2332.00, then 2325.00.
Technical comment:
Even though we cannot rule out the possibility of continued adjustments, their duration should be limited.
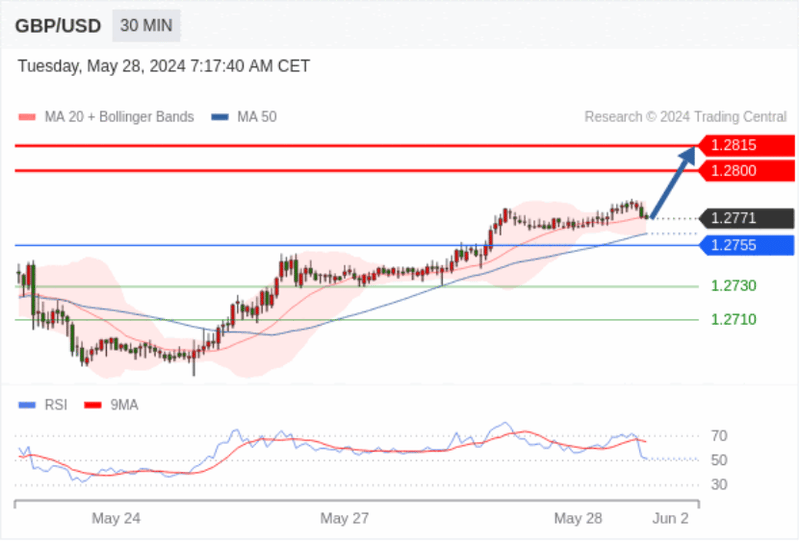
GBP/USD Intraday: Bullish above 1.2755.
Pivot point:
1.2755
Trading strategy:
Above 1.2755, bullish, target price at 1.2800, then 1.2815.
Alternative strategy:
Below 1.2755, bearish, target price set at 1.2730, then 1.2710.
Technical comment:
Above 1.2755 is a bullish signal, with an upward target of 1.2800.
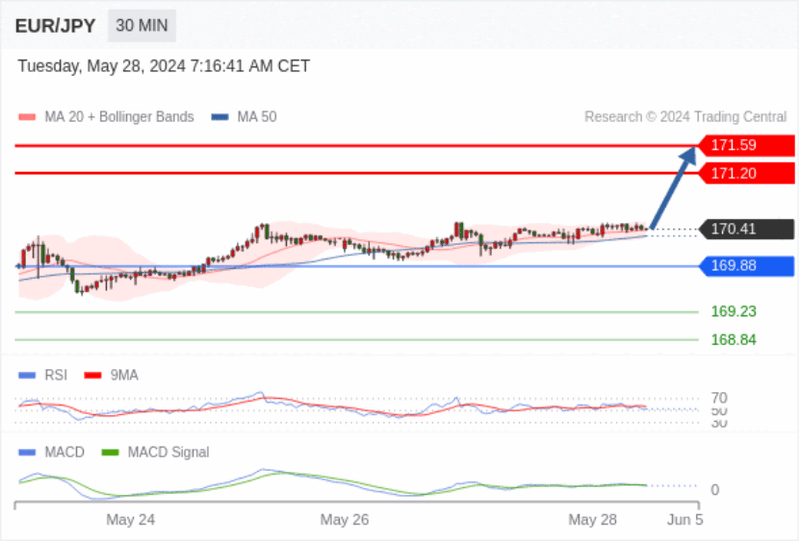
EUR/JPY Intraday: Bullish with support at 169.88, target set at 171.59.
Pivot point set at:
169.88
Trading strategy:
Bullish with support at 169.88, target set at 171.59.
Alternative strategy:
If it breaks below 169.88, EUR/JPY target direction set at 169.23 and 168.84.
Technical comment :
RSI technical indicator is above the neutral area of 50. MACD technical indicator is bullish and below its signal line. Additionally, the price is above the 20-day and 50-day moving averages (currently at 170.39 and 170.31).
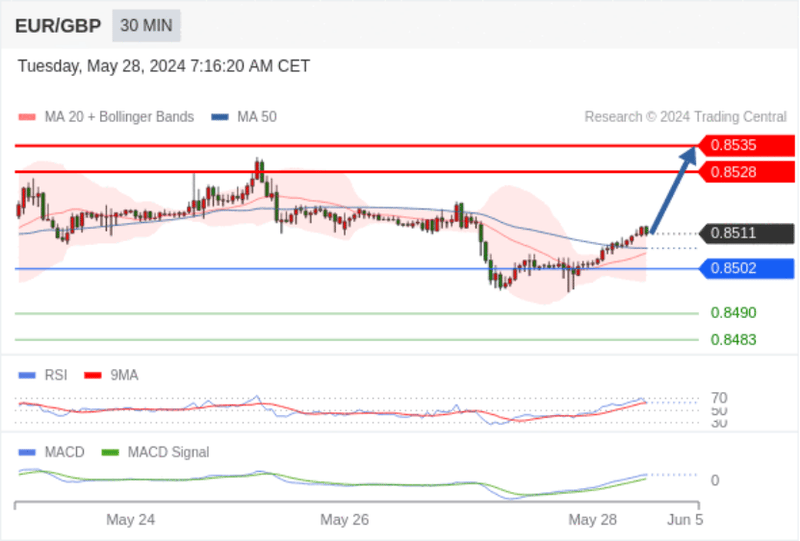
EUR/GBP Intraday: Bullish with support at 0.8502.
Pivot point set at:
0.8502
Trading strategy:
Bullish with support at 0.8502.
Alternative strategy:
Breaking below 0.8502 will bring a continued downward trend, with targets at 0.8490 then 0.8483.
Technical comment :
RSI technical indicator is above the neutral area of 50. MACD technical indicator is bullish and above its signal line. Additionally, the price is above the 20-day and 50-day moving averages (currently at 0.8506 and 0.8508).
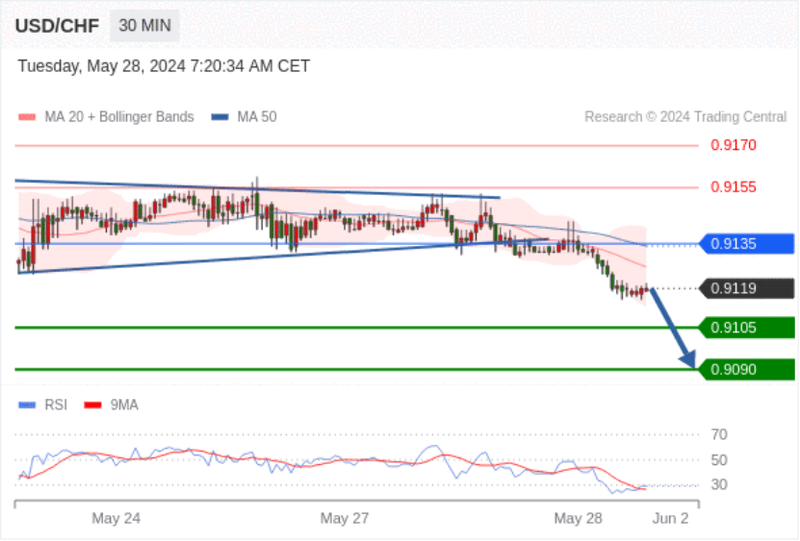
USD/CHF Intraday: Headed towards 0.9090.
Pivot point:
0.9135
Trading strategy:
Below 0.9135, bearish, target price at 0.9105, then 0.9090.
Alternative strategy:
Above 0.9135, bullish, target price set at 0.9155, then 0.9170.
Technical comment:
Breaking below 0.9135 is a bearish signal, with a downward target of 0.9105.
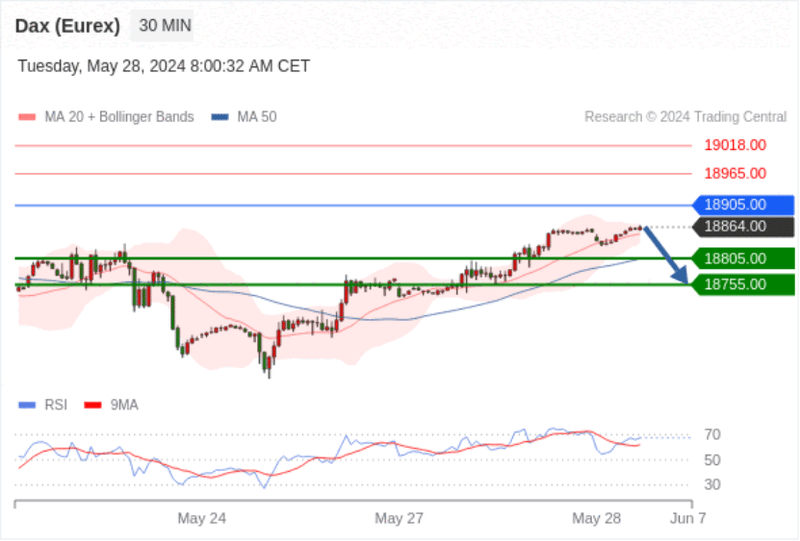
German DAX Futures (Eurex) (M4) Intraday: Short-term key resistance at 18905.00.
Pivot point:
18905.00
Trading strategy:
Below 18905.00, bearish, target price at 18805.00, then 18755.00.
Alternative strategy:
Above 18905.00, bullish, target price set at 18965.00, then 19018.00.
Technical comment:
RSI technical indicator trend is complex, operate with caution.
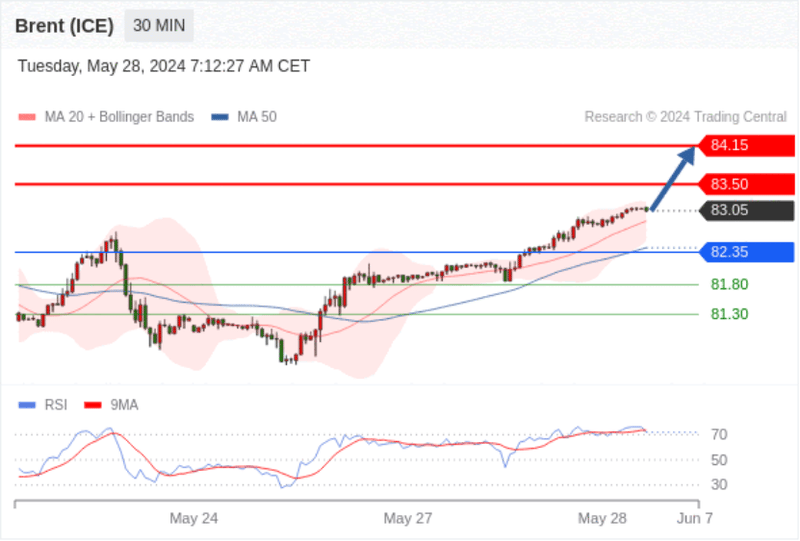
Brent Crude Oil (ICE) (Q4) Intraday: Uptrend.
Pivot point:
82.35
Trading strategy:
Above 82.35, bullish, target price at 83.50, then 84.15.
Alternative strategy:
Below 82.35, bearish, target price set at 81.80, then 81.30.
Technical comment:
RSI technical indicator is trending upwards.
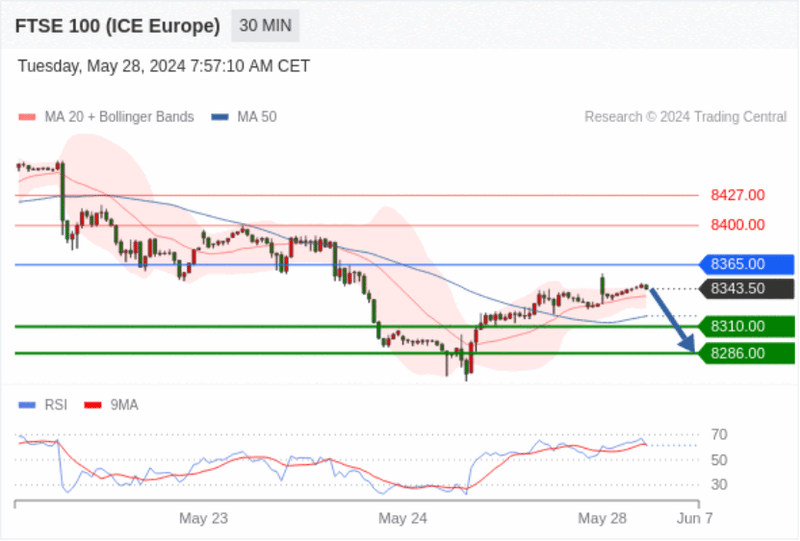
UK FTSE 100 Futures Intraday: Short-term key resistance at 8365.00.
Pivot point:
8365.00
Trading strategy:
Below 8365.00, bearish, target price at 8310.00, then 8286.00.
Alternative strategy:
Above 8365.00, bullish, target price set at 8400.00, then 8427.00.
Technical comment:
As long as the resistance at 8365.00 remains, price volatility has a bearish trend.