Explore today's market views from the Global Research Department of the Trading Center. Discover new trading methods and opportunities from popular trading products.
EUR/USD GBP/USD Spot Gold EUR/JPY EUR/GBP USD/CHF German DAX Index Futures (Eurex) Brent Crude Oil (ICE) UK FTSE 100 Index Futures
Kind reminder: Due to market fluctuations, prices may have crossed key levels, rendering strategies ineffective.
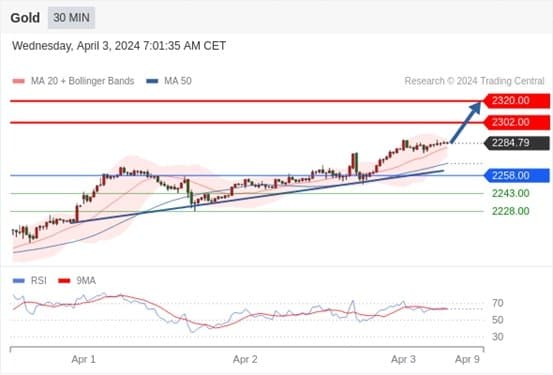
Spot Gold Intraday: Upward trend.
Pivot Point:
2258.00
Trading Strategy:
Above 2258.00, bullish with target prices at 2302.00, then 2320.00.
Alternative Strategy:
Below 2258.00, bearish with target prices at 2243.00, then 2228.00.
Technical Comment:
The RSI indicator shows a complex trend with a bias towards rising.
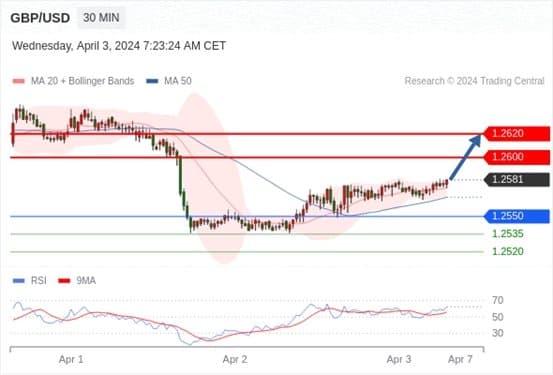
GBP/USD Intraday: A new rise.
Pivot Point:
1.2550
Trading Strategy:
Above 1.2550, bullish with target prices at 1.2600, then 1.2620.
Alternative Strategy:
Below 1.2550, bearish with target prices at 1.2535, then 1.2520.
Technical Comment:
The RSI indicator shows a further upward trend.
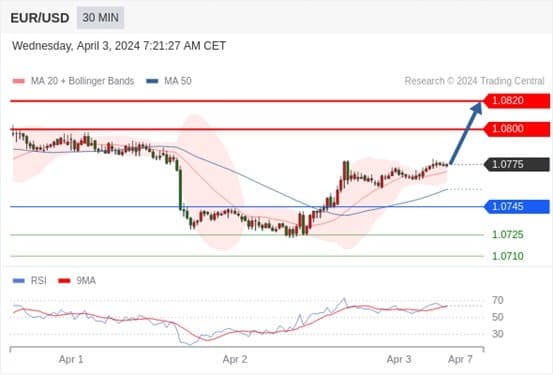
EUR/USD Intraday: Bullish.
Pivot Point:
1.0745
Trading Strategy:
Above 1.0745, bullish with target prices at 1.0800, then 1.0820.
Alternative Strategy:
Below 1.0745, bearish with target prices at 1.0725, then 1.0710.
Technical Comment:
The RSI indicator continues to show an upward trend.
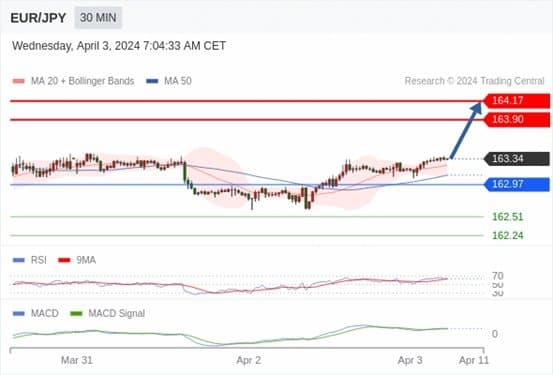
EUR/JPY Intraday: Bullish, with 162.97 as the support level.
Pivot Point: 162.97.
Trading Strategy:
Bullish, with 162.97 as the support level.
Alternative Strategy:
A break below 162.97 could lead to a continued downward trend, with targets at 162.51 then 162.24.
Technical Comment:
The RSI indicator is above the neutral 50 zone. The MACD indicator is above its signal line, bullish. In addition, prices are above their 20-day and 50-day moving averages (currently at 163.25 and 163.11).
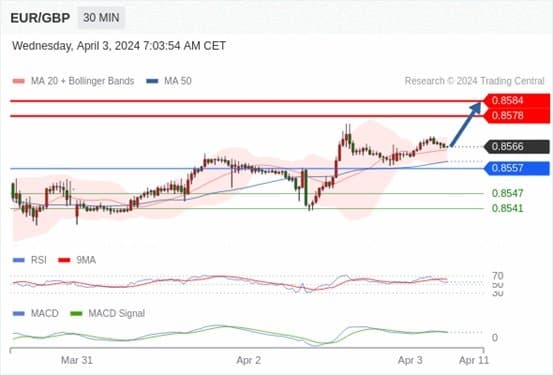
EUR/GBP Intraday: Bullish, with 0.8557 as the support level, targeting 0.8584.
Pivot Point set at:
0.8557
Trading Strategy:
Bullish, with 0.8557 as the support level, targeting 0.8584.
Alternative Strategy:
A break below 0.8557 could lead to a continued downward trend, with targets at 0.8547 then 0.8541.
Technical Comment:
The RSI indicator is above 50. The MACD indicator is bullish and below its signal line. Moreover, prices are above their 20-day and 50-day moving averages (at 0.8565 and 0.8560 respectively).
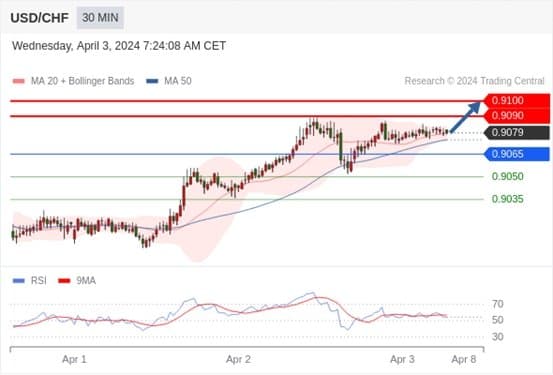
USD/CHF Intraday: Upward trend.
Pivot Point:
0.9065
Trading Strategy:
Above 0.9065, bullish with target prices at 0.9090, then 0.9100.
Alternative Strategy:
Below 0.9065, bearish with target prices at 0.9050, then 0.9035.
Technical Comment:
The RSI indicator shows a complex trend with a bias towards rising.
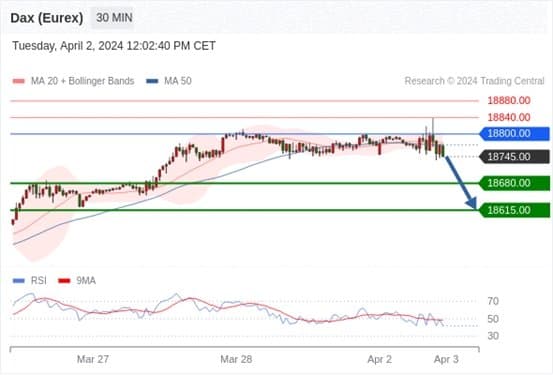
German DAX Index Futures (Eurex) (M4) Intraday: Key short-term resistance at 18800.00.
Pivot Point:
18800.00
Trading Strategy:
Below 18800.00, bearish with target prices at 18680.00, then 18615.00.
Alternative Strategy:
Above 18800.00, bullish with target prices at 18840.00, then 18880.00.
Technical Comment:
The RSI indicator is below the neutral 50% zone.
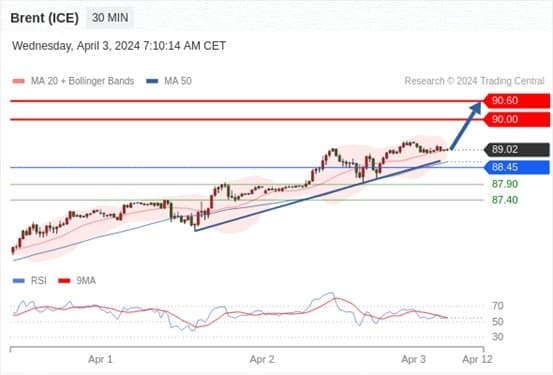
Brent Crude Oil (ICE) (M4) Intraday: Bullish above 88.45.
Pivot Point:
88.45
Trading Strategy:
Above 88.45, bullish with target prices at 90.00, then 90.60.
Alternative Strategy:
Below 88.45, bearish with target prices at 87.90, then 87.40.
Technical Comment:
The RSI indicator shows a complex trend with a bias towards rising.
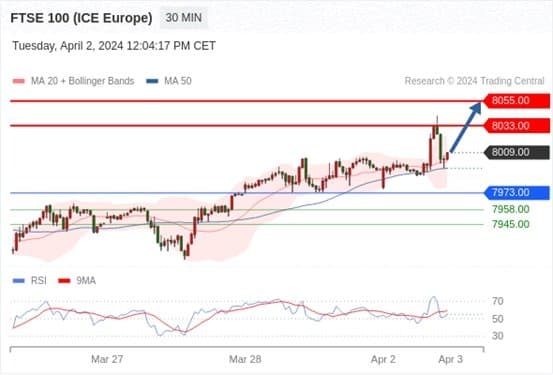
UK FTSE 100 Index Futures Intraday: Bullish above 7973.00.
Pivot Point:
7973.00
Trading Strategy:
Above 7973.00, bullish with target prices at 8033.00, then 8055.00.
Alternative Strategy:
Below 7973.00, bearish with target prices at 7958.00, then 7945.00.
Technical Comment:
The RSI indicator shows a complex trend with a bias towards rising.