• Home
  • Categories
  • News
  • Community
EN
EN
Home
CategoriesNewsGlossaryCommunity
Contact Us
Social Media
Region
🌏International
Region
🌏International
Contact
Home
/
News
/
FxPro Forex: Daily Technical Analysis before the European Market Opens, March 13, 2024

FxPro Forex: Daily Technical Analysis before the European Market Opens, March 13, 2024

FxProFxPro
2024-03-13
Summary:FxPro Forex: Daily Technical Analysis before the European Market Opens, March 13, 2024

View today's market view from the Global Research Department at the Trade Center. Explore new trading methods and opportunities from popular trading products.

EUR/USD   GBP/USD   Spot Gold   EUR/JPY   EUR/GBP   USD/CHF   Germany DAX Index Futures (Eurex)   Brent Crude (ICE)   UK FTSE 100 Index Futures  

Kind reminder: Due to market fluctuations, prices may have crossed key points, making the strategy ineffective.

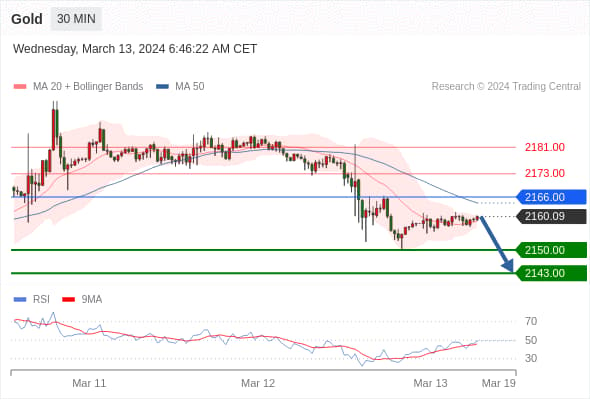
Spot Gold Intraday: Targeting 2143.00.

Pivot Point:

2166.00

Trading Strategy:

Below 2166.00, bearish, target levels at 2150.00, then 2143.00.

Alternative Strategy:

Above 2166.00, bullish, target levels set at 2173.00, then 2181.00.

Technical Comment:

As long as the resistance at 2166.00 is not breached, the risk of a drop to below the 2150.00 position is high.

Image 1

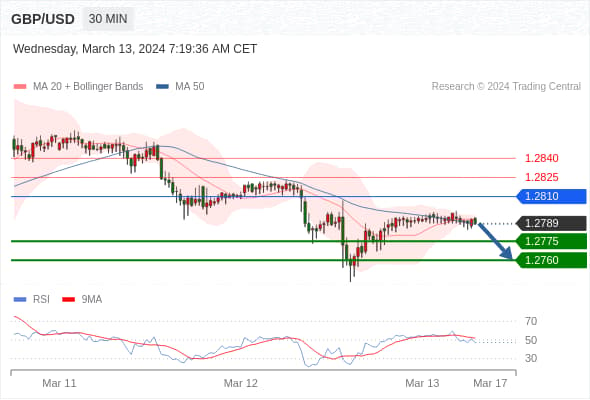
GBP/USD Intraday: Key short-term resistance at 1.2810.

Pivot Point:

1.2810

Trading Strategy:

Below 1.2810, bearish, target levels at 1.2775, then 1.2760.

Alternative Strategy:

Above 1.2810, bullish, target levels set at 1.2825, then 1.2840.

Technical Comment:

The potential for a rise may be capped by the resistance at 1.2810.

Image 2

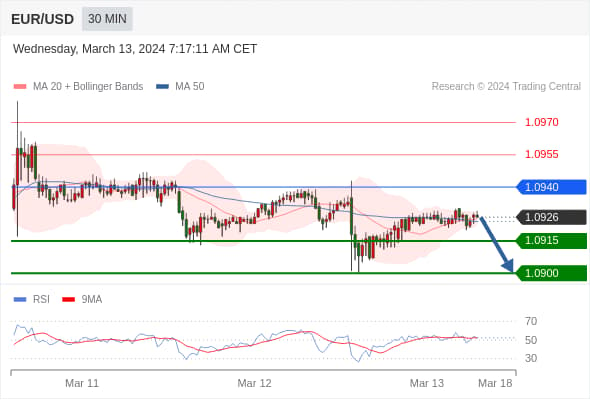
EUR/USD Intraday: Key short-term resistance at 1.0940.

Pivot Point:

1.0940

Trading Strategy:

Below 1.0940, bearish, target levels at 1.0915, then 1.0900.

Alternative Strategy:

Above 1.0940, bullish, target levels set at 1.0955, then 1.0970.

Technical Comment:

As long as the resistance at 1.0940 is not breached, the risk of a drop to below the 1.0915 position is high.

Image 3

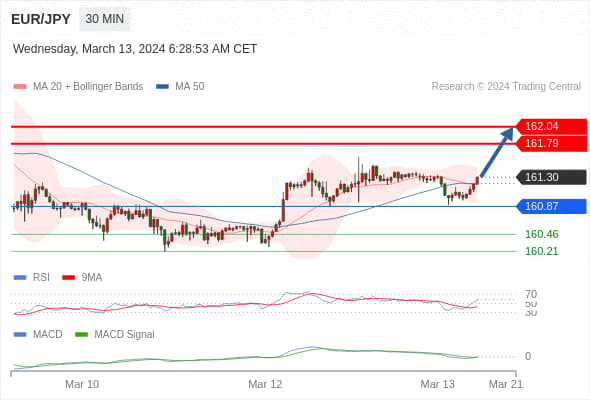
EUR/JPY Intraday: Bullish, provided 160.87 is not breached.

Pivot Point: 160.87.

Trading Strategy:

Bullish, provided 160.87 is not breached.

Alternative Strategy:

If it falls below 160.87, target directions set at 160.46 and 160.21.

Technical Comment:

RSI indicator is above 50. MACD indicator is bearish and above its signal line. Additionally, the price is above its 20-day and 50-day moving averages (situated at 161.19 and 161.21, respectively).

Image 4

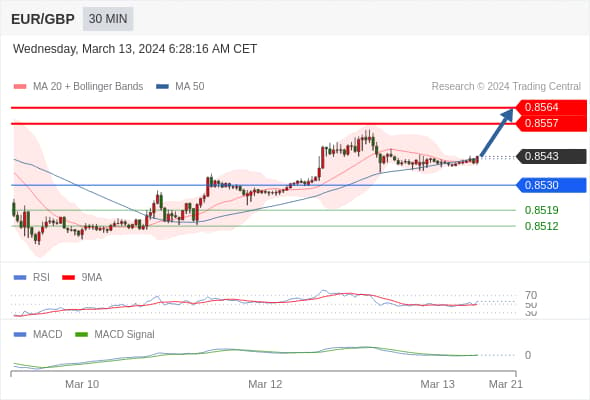
EUR/GBP Intraday: Bullish, with 0.8530 as support.

Pivot Point: 0.8530.

Trading Strategy:

Bullish, with 0.8530 as support.

Alternative Strategy:

If it breaks below 0.8530, target directions set at 0.8519 and 0.8512.

Technical Comment:

RSI indicator is above 50. MACD indicator is bullish and above its signal line. Moreover, the price is above its 20-day and 50-day moving averages (situated at 0.8540 and 0.8542, respectively). Finally, the stock price is currently above the upper band of the Bollinger channels (situated at 0.8542).

Image 5

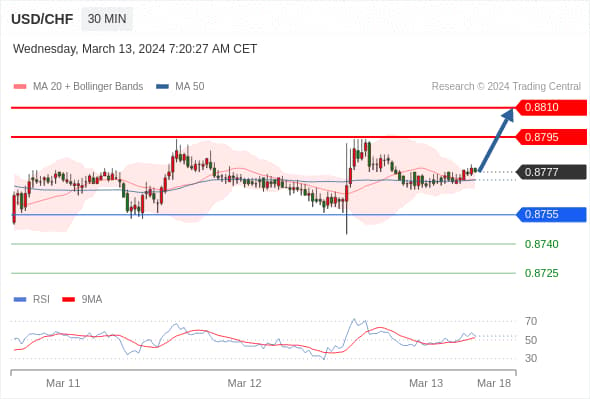
USD/CHF Intraday: Uptrend.

Pivot Point:

0.8755

Trading Strategy:

Above 0.8755, bullish, target levels at 0.8795, then 0.8810.

Alternative Strategy:

Below 0.8755, bearish, target levels set at 0.8740, then 0.8725.

Technical Comment:

RSI indicator is trending upwards.
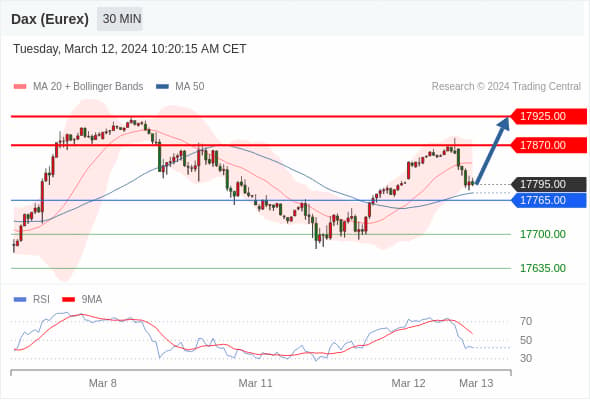
Image 6

Germany DAX Index Futures (Eurex)‎ (H4)‎ Intraday: Ultra short-term (intraday) support around 17765.00.

Pivot Point:

17765.00

Trading Strategy:

Above 17765.00, bullish, target levels at 17870.00, then 17925.00.

Alternative Strategy:

Below 17765.00, bearish, target levels set at 17700.00, then 17635.00.

Technical Comment:

RSI indicator lacks momentum
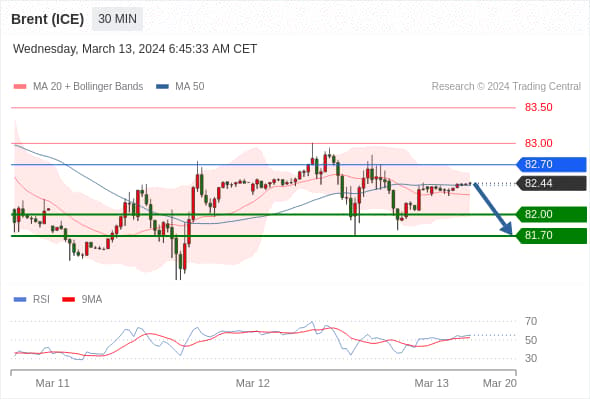
Image 7

Brent Crude (ICE)‎ (K4)‎ Intraday: Short-term key resistance at 82.70.

Pivot Point:

82.70

Trading Strategy:

Below 82.70, bearish, target levels at 82.00, then 81.70.

Alternative Strategy:

Above 82.70, bullish, target levels set at 83.00, then 83.50.

Technical Comment:

As long as the resistance at 82.70 exists, there is a bearish trend in price volatility.

Image 8

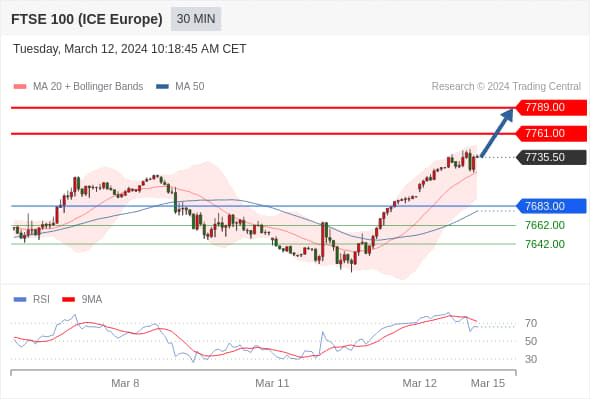
UK FTSE 100 Index Futures Intraday: A new round of rise.

Pivot Point:

7683.00

Trading Strategy:

Above 7683.00, bullish, target levels at 7761.00, then 7789.00.

Alternative Strategy:

Below 7683.00, bearish, target levels set at 7662.00, then 7642.00.

Technical Comment:

Even though we cannot exclude the possibility of a continued adjustment, it should be limited in terms of duration.

Image 9

Risk Warning and Disclaimer

The market carries risks, and investment should be cautious. This article does not constitute personal investment advice and has not taken into account individual users' specific investment goals, financial situations, or needs. Users should consider whether any opinions, viewpoints, or conclusions in this article are suitable for their particular circumstances. Investing based on this is at one's own responsibility.

The End
Previous
Next

Comments

0/1000

You Missed

Why are fewer and fewer people trading? Perhaps this article can provide you with the answer.

Why are fewer and fewer people trading? Perhaps this article can provide you with the answer.

According to data provided by brokers, 40% of traders give up trading after one month, and only 7% remain active after five years.

亚伦_TK_LOXmv
亚伦_TK_LOXmv
2024-06-04
Investment
Investment
2024-06-04
Major indices fell as AI surged but semiconductors dragged sentiment.

Major indices fell as AI surged but semiconductors dragged sentiment.

On November 15th, A-shares fell as AI gained, but semiconductors and photovoltaics plunged, with over 3,100 stocks declining.

2024-11-15
Stock price
Stock price
2024-11-15
Powell highlighted U.S. economic strength, noting cautious rate cuts; market reaction was mixed.

Powell highlighted U.S. economic strength, noting cautious rate cuts; market reaction was mixed.

Fed Chair Jerome Powell stated the strong U.S. economy allows for a measured pace in adjusting interest rates, pressuring the stock market to decline while Treasury yields rise.

2024-11-15
Stock Market Volatility
2024-11-15
What is Hoarding and Profiteering? Five Questions about Hoarding and Profiteering You Need to Know

What is Hoarding and Profiteering? Five Questions about Hoarding and Profiteering You Need to Know

Hoarding is stockpiling goods to inflate prices for profit, seen in commodity markets, especially with essential products, driven by greed.

TraderKnows
TraderKnows
2024-04-30
2024-04-30
Australian Strikes Tear Through the Calm Facade of the Liquefied Gas Market

Australian Strikes Tear Through the Calm Facade of the Liquefied Gas Market

If no agreement is reached or hints of supply threats arise, it could panic the market. This reminds us that after last year's LNG price surge, any tension could cause significant price fluctuations.

TraderKnows
TraderKnows
2024-05-06
New York Mercantile Exchange
2024-05-06

Wiki

Contract for Difference (CFD)

Contract for Difference (CFD) refers to a financial derivative in which investors and counterparties engage in speculative or hedging transactions by exchanging the price difference of a commodity. Importantly, this occurs without the need to physically own or trade the underlying asset.

Organization

Active

FxProFxPro

Recent Post

Yields on South Korean government bonds face upward pressure amid policy shifts and supply rise

a day ago

South Korea's car exports reach record high as demand for EVs and SUVs drives strong growth

a day ago

Bank of America tests stablecoins prompting Wall Street to follow suit

a day ago

The yen resumes its decline as the U.S. dollar rebounds sharply amid shifting market dynamics

a day ago

Taleb warns of looming twin threats: a mounting debt crisis and declining currency confidence

a day ago

The EU strongly counteracts, causing the US dollar to fluctuate and weaken.

a day ago

Trump's statement triggers a chain reaction in the market.

a day ago

Powell's position at the Fed becomes a flashpoint of political controversy and market uncertainty

a day ago

U.S. Treasury yields soar as inflation data draws attention.

a day ago

The Federal Reserve's independence faces pressure as Wall Street voices strong support in response

a day ago

Monexis EXPOSED: An Out-and-Out Scam. Here Are the 5 Pieces of Proof

07-16

Trump announces a trade agreement with Indonesia.

07-16

TSMC begins construction of its second wafer fabrication plant in Japan.

07-16

Dallas Fed President: Interest Rates Need to Stay Steady Under Inflation Pressure

07-16

Trump urges for interest rate cuts, but Wall Street sides with Powell.

07-16

You Missed

Why are fewer and fewer people trading? Perhaps this article can provide you with the answer.

Why are fewer and fewer people trading? Perhaps this article can provide you with the answer.

According to data provided by brokers, 40% of traders give up trading after one month, and only 7% remain active after five years.

亚伦_TK_LOXmv
亚伦_TK_LOXmv
2024-06-04
Investment
Investment
2024-06-04
Major indices fell as AI surged but semiconductors dragged sentiment.

Major indices fell as AI surged but semiconductors dragged sentiment.

On November 15th, A-shares fell as AI gained, but semiconductors and photovoltaics plunged, with over 3,100 stocks declining.

2024-11-15
Stock price
Stock price
2024-11-15
Powell highlighted U.S. economic strength, noting cautious rate cuts; market reaction was mixed.

Powell highlighted U.S. economic strength, noting cautious rate cuts; market reaction was mixed.

Fed Chair Jerome Powell stated the strong U.S. economy allows for a measured pace in adjusting interest rates, pressuring the stock market to decline while Treasury yields rise.

2024-11-15
Stock Market Volatility
2024-11-15
What is Hoarding and Profiteering? Five Questions about Hoarding and Profiteering You Need to Know

What is Hoarding and Profiteering? Five Questions about Hoarding and Profiteering You Need to Know

Hoarding is stockpiling goods to inflate prices for profit, seen in commodity markets, especially with essential products, driven by greed.

TraderKnows
TraderKnows
2024-04-30
2024-04-30
Australian Strikes Tear Through the Calm Facade of the Liquefied Gas Market

Australian Strikes Tear Through the Calm Facade of the Liquefied Gas Market

If no agreement is reached or hints of supply threats arise, it could panic the market. This reminds us that after last year's LNG price surge, any tension could cause significant price fluctuations.

TraderKnows
TraderKnows
2024-05-06
New York Mercantile Exchange
2024-05-06

Risk Warning

TraderKnows is a financial media platform, with information displayed coming from public networks or uploaded by users. TraderKnows does not endorse any trading platform or variety. We bear no responsibility for any trading disputes or losses arising from the use of this information. Please be aware that displayed information may be delayed, and users should independently verify it to ensure its accuracy.