View today's market perspectives from the Global Research Department of the Trading Center. Explore new trading methods and opportunities from popular trading products.
EUR/USD Spot Gold GBP/USD EUR/JPY EUR/GBP USD/CHF German DAX Futures (Eurex) Brent Crude (ICE) UK FTSE 100 Futures
Friendly reminder: Due to market fluctuations, prices may have crossed key levels, rendering strategies ineffective.
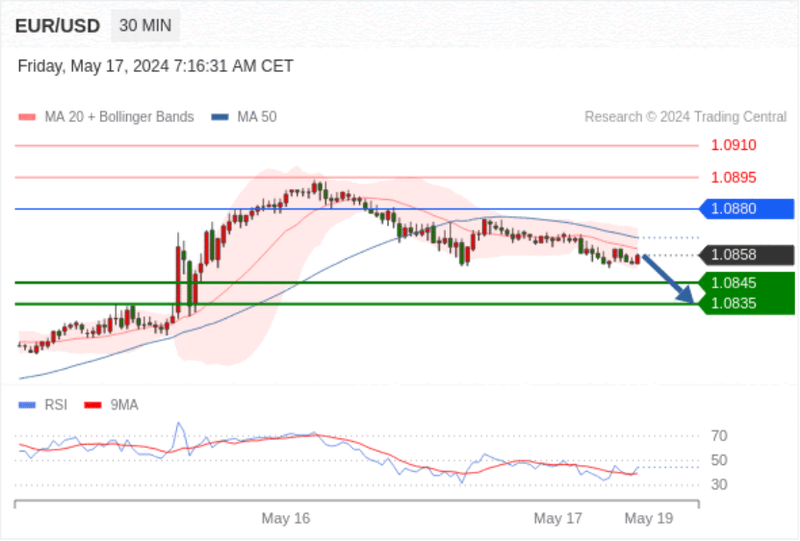
EUR/USD Intra-Session: Under Pressure.
Pivot Point:
1.0880
Trading Strategy:
Bearish below 1.0880, target prices at 1.0845, then 1.0835.
Alternative Strategy:
Bullish above 1.0880, target prices at 1.0895, then 1.0910.
Technical Analysis:
The RSI indicator runs a complex trend, inclined to fall.
![c281e4920da9404d8d9e38250463e48d371](https://production-app-asset.traderknows.com/images/623dafe4dc8a428b82bfb66a3c8b639f.width-800.png?Expires=1724627555&Signature=CLnJ-evPsfbYTwcSoNBRIHGMkyjC-IQ-rb27cur3ARmsCnUu9WJJqRBhO84hDEsTzqktxQ1VRBtkkA-ZRuOs5WJXRMHbxx0SwVXjMsDquYOFX9McK~t9hJ8NBndOq1yjG5GhYksL1cd50dtMmzwnX4VRJocrRMbpT5XltwiD5WY8mbM8zdLDTht0ia1beA0FkfaBsNViGaqiMCtRyZLEDv0lUb-kPpbESodQkO3dAZXDQCtfaGdgfWQIFsg07hOtkaploVkiw2G9FdB4~E1Y1wy82Jh2WmmWlIC7YlWTC5ONNXIS9FhPAQM60EekXRxYsG-CYCOmvGde3ri4zc2L-Q__&Key-Pair-Id=K3LHBTUA5A7KEY)
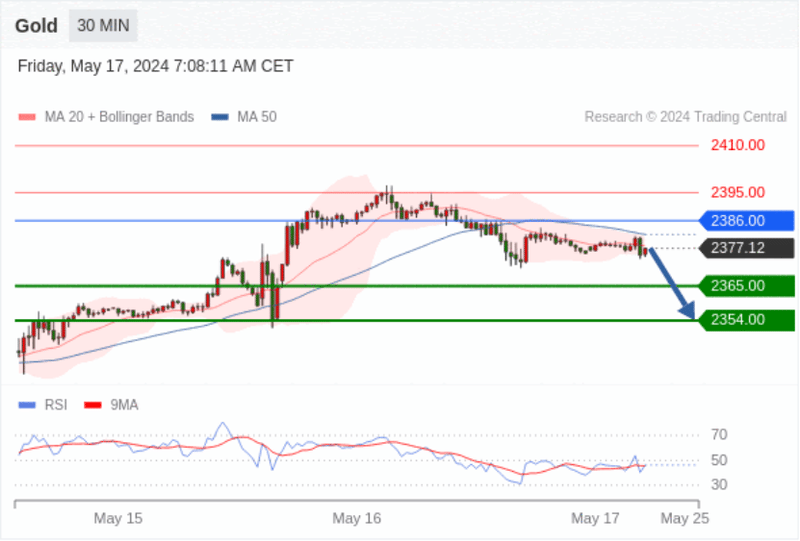
Spot Gold Intra-Session: Downtrend.
Pivot Point:
2386.00
Trading Strategy:
Bearish below 2386.00, target prices at 2365.00, then 2354.00.
Alternative Strategy:
Bullish above 2386.00, target prices at 2395.00, then 2410.00.
Technical Analysis:
The RSI indicator is below the 50% neutral zone.
![c281e4920da9404d8d9e38250463e48d549](https://production-app-asset.traderknows.com/images/e51c877d252a420ba07335b74000e547.width-800.png?Expires=1724627555&Signature=ARrYbwE1Z9FdelVD7cmYGE8wHz2yd-ufgRZ-5mSMo1KKEGvCUypxsAp0jLbGm1-JZmX2ZHFDajeTaWWsmF2hhqtt2wKAaDeIde1CxUQTMbzosisqCxMVwqIDlOXVrA5Wa-~RlwSuvR256b7EmnXR3GHjRn2B-najfxuLnyLDF-oJgLjAGMFk186e49vSE9aVLx0pCXZB8CVPEkXWYwykYisth9emTzDZV4sLKYT9R7uF-UCv~oc11cc843YCdG10ufvE4v6S-PMAfcGdbsCJyVMKNXgRKiVN2pI2UOzpra0AuhCdlnjp5RfV2UfgaRcZ2xK1e0nsY2pqA3oRJZZL9Q__&Key-Pair-Id=K3LHBTUA5A7KEY)
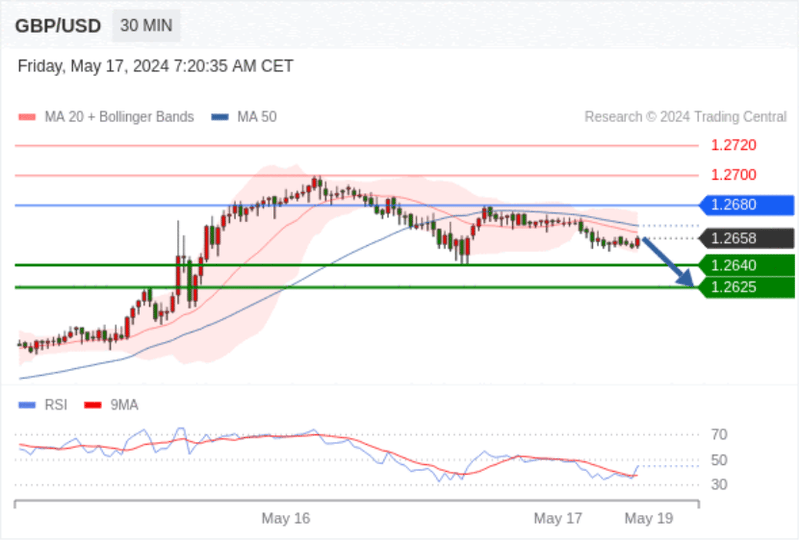
GBP/USD Intra-Session: Under Pressure.
Pivot Point:
1.2680
Trading Strategy:
Bearish below 1.2680, target prices at 1.2640, then 1.2625.
Alternative Strategy:
Bullish above 1.2680, target prices at 1.2700, then 1.2720.
Technical Analysis:
The RSI indicator runs a complex trend, inclined to fall.
![c281e4920da9404d8d9e38250463e48d723](https://production-app-asset.traderknows.com/images/e37debc95b304bfba23c8fbb755ad784.width-800.png?Expires=1724627555&Signature=X6-XvhPfz3E9S9EVL5XZGACNV6~oJsOkurpxIuTB0Je6AIbFey~oh~CxlxrJpp03fJ~cPXRNJ10iINRibgGLBLH33XLieilsXtrr4vmpTdJ5JAg7F5XUec9WxvPLygYP9hql6ttvncvI5UX8X1paJ1T1C3Md24qchWsao8PiYwBtirFwcqTdbfZSBZU0ok28fZF0T7SV~3EK6mfpSZ-PS0xbubrJxwb8MSKsmntBT8CLyipxl0EVbaE42HBUE9pw8EOzxgxgMjs2ZXZHVnTdcfCUvQJCE8uZ-h7cdqGEAuxnrOtVxR-3ou~b7ywXz1EdYZf6xubJVveKNJl4w~s67w__&Key-Pair-Id=K3LHBTUA5A7KEY)
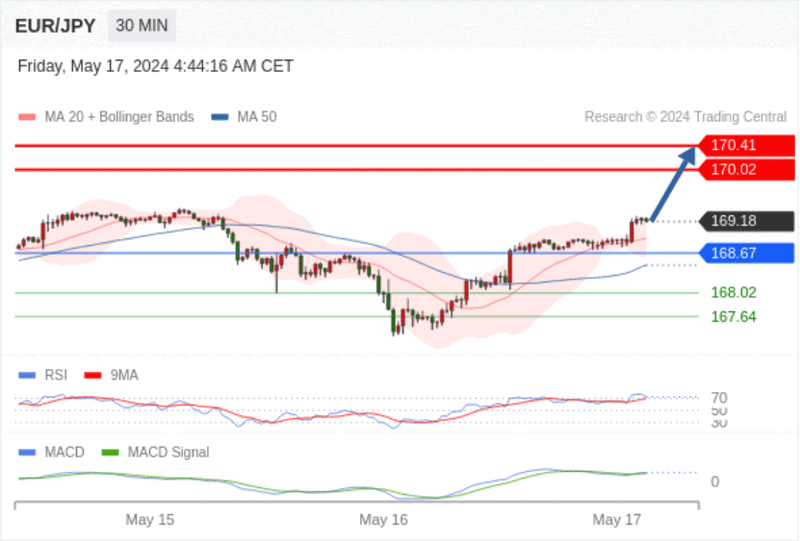
EUR/JPY Intra-Session: Bullish, Supported at 168.67.
Pivot Point:
168.67
Trading Strategy:
Bullish as long as 168.67 holds as a support.
Alternative Strategy:
A downward break of 168.67 will signal further decline, targeting 168.02, then 167.64.
Technical Analysis:
With the RSI above 70, it indicates a continued upward trend or an overbought condition requiring technical adjustment. Compare the RSI and price trend for potential divergence. The MACD shows a bullish state above its signal line. Additionally, the price is above both its 20-day and 50-day moving averages (currently at 168.91 and 168.47).
![c281e4920da9404d8d9e38250463e48d1048](https://production-app-asset.traderknows.com/images/e6601d671b654bf0ae0e43fe4d8048d3.width-800.png?Expires=1724627555&Signature=RhPOI7lmbDowcpBviumwjFDNtA8EeUROQPBFbJZKIN8D69SKdFE94qS0j3XNYiQNebSTNOOfAwpSe8SLs8I32RvYAr8lP4QjqYyKWkmSXGQbS2wzL7~VqzdFuC7x7n2nzxNu1STNkqFepo~vkTPSQPj-~nSTXcAikkMA27btksD1AMp9AbiDBAmwLGzxTL-x~WWLoNo25Yej5o1Ov8BUvmOsw-irgAM61n2LSMVogi7V3rAMfPh33FhezSgHo7t98pnMKZaO8eQWYjH2T-Uafh97MDYxdkQVQvz0kWq8kvFl2O4tSWDYQ0ylRtphJfFCelwRizLdHrhhMRUVD2MdRQ__&Key-Pair-Id=K3LHBTUA5A7KEY)
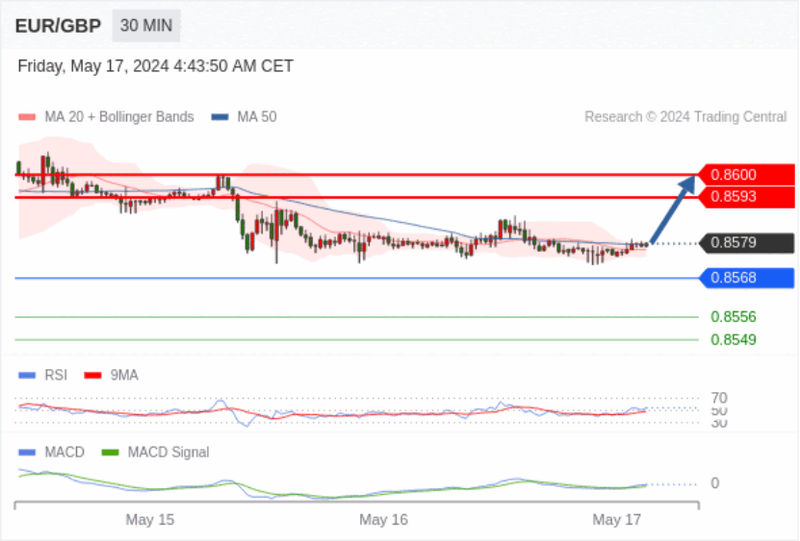
EUR/GBP Intra-Session: Bullish unless 0.8568 is breached.
Pivot Point:
0.8568
Trading Strategy:
Bullish as long as 0.8568 is not breached.
Alternative Strategy:
A downward break of 0.8568 will signal further decline, targeting 0.8556, then 0.8549.
Technical Analysis:
The RSI exceeds 50. The MACD is above its signal line, indicating bullishness. Additionally, the price is above both its 20-day and 50-day moving averages (currently at 0.8577 and 0.8578).
![c281e4920da9404d8d9e38250463e48d1280](https://production-app-asset.traderknows.com/images/347aee1b91cf4a6080e2f335cd5ce8e3.width-800.png?Expires=1724627555&Signature=IwlG9MEEWovbWhGqnHBqgxv8cHdH3kAETxOArjg8v~SgkVTCzVnRd4lUgfe9ZSUo4IcusUanBPgXpuelsFKPmf75UbffSExUyJDKplt36JroZqdMHt1Ep5OUWj547jimSGaVw~uwb1cpaCvizr~lPRRKQkK51wydf2YU6v7ZPCzJoc2-uioYKgSrNuaXjqaqcLnqjvaBbcoAwh-ITAjJPEbjtPlank24s~lfVgbPKHdt2dqeNx59xaiD1J0EOtIeyUh1vm2q-CGtQKTFwU3I-ZHzKPvfHnd0OJB5L-vBIRAbzn0MwwJM6QHeg6XfJvDdwj0sahkdBvnKtfijY1hhDQ__&Key-Pair-Id=K3LHBTUA5A7KEY)
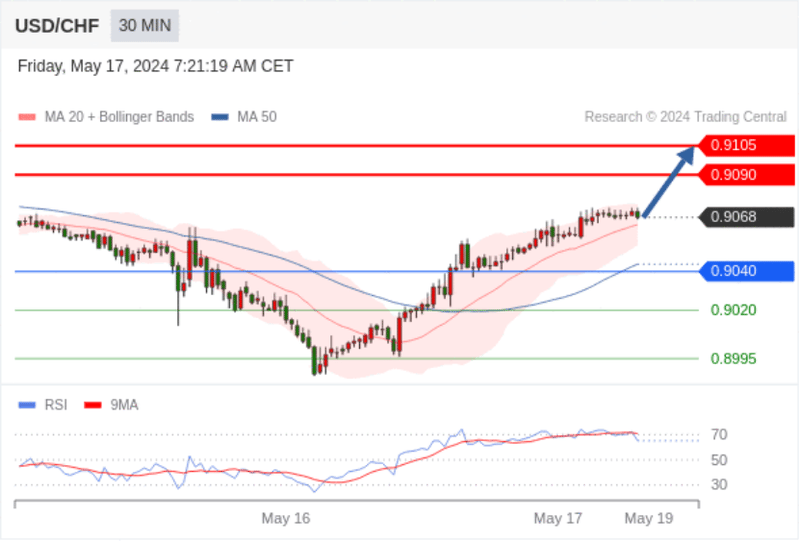
USD/CHF Intra-Session: Uptrend.
Pivot Point:
0.9040
Trading Strategy:
Bullish above 0.9040, target prices at 0.9090, then 0.9105.
Alternative Strategy:
Bearish below 0.9040, target prices at 0.9020, then 0.8995.
Technical Analysis:
The RSI indicator is trending upwards.
![c281e4920da9404d8d9e38250463e48d1444](https://production-app-asset.traderknows.com/images/ef9beb1af1be45159f6462ad5329df41.width-800.png?Expires=1724627555&Signature=0XpGmCtvjKHxZnpQKQViEcWjNXC2IM~FC25PkOt3yfPS5b-hxz~O7daTKMfxxbDuPFMdx03Drwfi8CUaNsbAfPQF7sAz5vrpyILMG0spK1Q8Mb99b8dwPppcuZz~seWXtJV5gnBsn1VA2PAmAFI2e1LeUivXB5mWzPmni90wBs5iyIwAq9fy6iyBqpw6vUfGNv-cSyXDFpRsiAk39nlJk9rLUHw91OvlsiSnqAMANAWZaUHprjnrouyCMO0ia6cFvrPnMwfA97Km330hhi9lGah3Ggor8Dtf3~079O8s03-L8fY3QlSSvaazb~W2XnNNY~TUcG8cnJRI~cvnhjP8Fg__&Key-Pair-Id=K3LHBTUA5A7KEY)
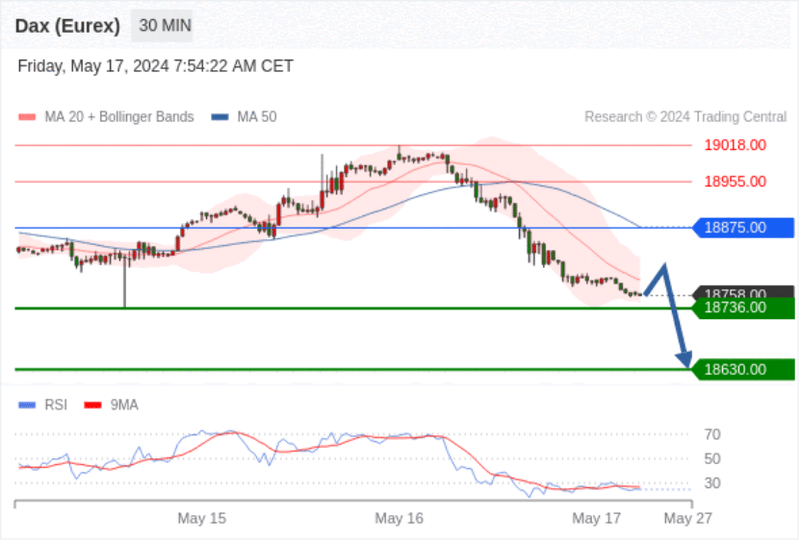
German DAX Futures (Eurex) Intra-Session: Under Pressure.
Pivot Point:
18875.00
Trading Strategy:
Bearish below 18875.00, target prices at 18736.00, then 18630.00.
Alternative Strategy:
Bullish above 18875.00, target prices at 18955.00, then 19018.00.
Technical Analysis:
RSI indicator falls below its 30 level.
![c281e4920da9404d8d9e38250463e48d1648](https://production-app-asset.traderknows.com/images/6795a2f082074cf4ab394f58a70693c0.width-800.png?Expires=1724627555&Signature=wafX~lFtVG4aMriwABniorSVdJ9GcFhhPYpw4YF7bAVDwMm3j3Hehs7XeAIYLcooTcaYeZzqF2tS5rulkozuSFrzFZXUSKr~YFQw1WSMbx4N5u6XD8Kp~cDEkNanxnD-Iv8MD9cAzBUSnOwKPfB4cPZF0MbfVklQlCJuHMAUkKBs6OVtxGJXOBUEgOPDrbxL414TPJ~Z1nAsn7vEUXsZzBhiUBpH0TaFTnAu5j~MGTpc4mqrW8vrUfO~HwR~VyYNCAslmc40DSGecIx3~GWTlj-7i4iYEZ4HN1DCm70nzFT0uO6SQKtZtYWOr8eGH4CbhtoUc3qNDUAX2DZYRVNDAg__&Key-Pair-Id=K3LHBTUA5A7KEY)
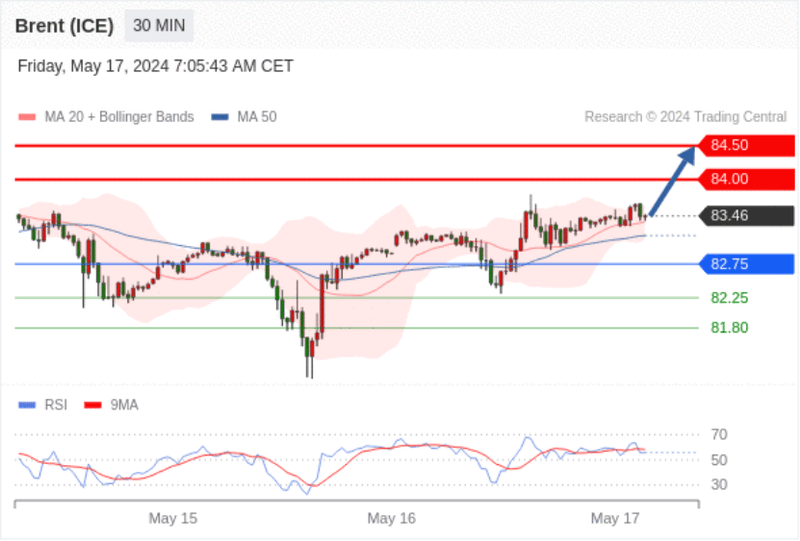
Brent Crude (ICE) Intra-Session: Uptrend.
Pivot Point:
82.75
Trading Strategy:
Bullish above 82.75, target prices at 84.00, then 84.50.
Alternative Strategy:
Bearish below 82.75, target prices at 82.25, then 81.80.
Technical Analysis:
The RSI indicator is above the 50% neutral zone.
![c281e4920da9404d8d9e38250463e48d1823](https://production-app-asset.traderknows.com/images/ba0a1083bab745d98c5158108af70bfa.width-800.png?Expires=1724627555&Signature=IW34cP3KqMKQL9i9RcMv8HbpZ3MoZvw-gcngaanHkjwTS-N-nFU~iiucifhK3oivMxUzzKPg0IJXCPI5l~qRz1KoMuGJmQdF0deA64xYbS0yjnm0dJVWA-kB5z-9lwHo88Iwsnb~LpJJF7yRZhbB1mA4TiyPUwA7mlk7ayJ32k6Z7YBuHqp~Bzwxbn9pcJ8aYKEe4sQpkvEKdEfN7UzFhMonvqPxAlIVtnVTOHATK5rEmEBI3S1NI05xxi5sai2e6T7mXSa8DAKpoXNz3b7sGk3Bwu3C8PNH-o-JNfLe5pC9-q33gama09Kqkfy3o8wBr7W6WQa~phnCj1UAp2TDkQ__&Key-Pair-Id=K3LHBTUA5A7KEY)
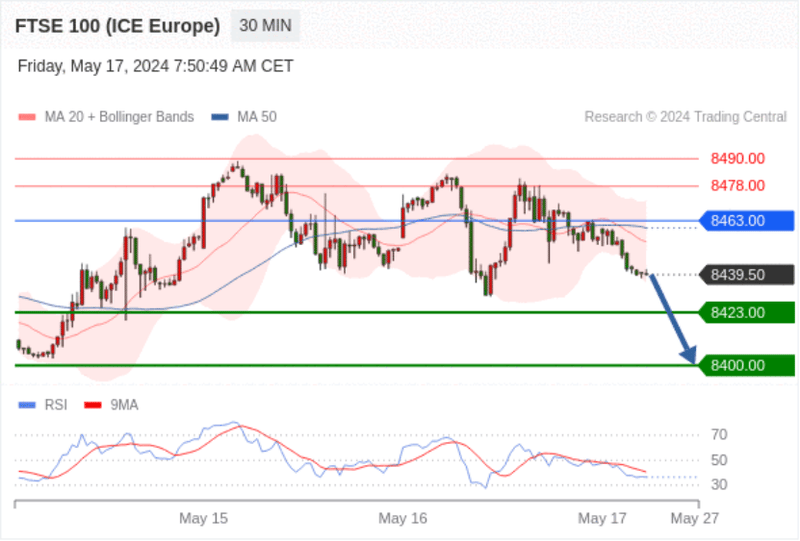
UK FTSE 100 Futures Intra-Session: No Significant Change.
Pivot Point:
8463.00
Trading Strategy:
Bearish below 8463.00, target prices at 8423.00, then 8400.00.
Alternative Strategy:
Bullish above 8463.00, target prices at 8478.00, then 8490.00.
Technical Analysis:
As long as resistance at 8463.00 persists, the price movement tends to be bearish.
![c281e4920da9404d8d9e38250463e48d2023](https://production-app-asset.traderknows.com/images/3ca2f257a63248358dd6416fb078b36b.width-800.png?Expires=1724627555&Signature=fOftRf5Fad0NfLXqvlP0RSCQ0fdu9BxclABQ9rGFO9QSmQAUi5zljijUDuHZ6jRJb~A3SwxBZfiqXM1w7YpEudVxSYOhkjE5m2itrrpfSYztBvNelTp0EZM0198dArpTnJZzwezEdwJL7DHuUpers-q4loEkeqo~0xajty~Dq7WGSXm71-aUSEcgdVWiwTxN97lzKYaImcunEGCZSaPRwkDVZWl7jHh97M2NKqLRD9w60vDGQF-aMaiZwkhWqWo3DdwDs10BKo9UlNOOJ9MnlGEi~NKuAIvel5bskZ-TO2TLmr99Joy6BxSKGgwLigzE2b25dCW2~xu6juN20g-EKg__&Key-Pair-Id=K3LHBTUA5A7KEY)