• Home
  • Categories
  • News
  • Community
EN
EN
Home
CategoriesNewsGlossaryCommunityAbout Us
Contact Us
Social Media
Region
🌏International
Region
🌏International

Copyright © 2023-2026 Traderknows Ltd. All rights reserved.

Contact
Home
/
News
/
Fibonacci Arcs in Forex.

Fibonacci Arcs in Forex.

TraderKnows IndiaTraderKnows India
2024-08-28
Summary:Fibonacci Arcs are a powerful tool used by forex traders to predict potential support and resistance levels in the market.

How to Use Fibonacci Arcs in Forex Trading?

Fibonacci Arcs are a technical analysis tool that predicts potential support and resistance levels based on the Fibonacci sequence. They are particularly useful for identifying possible retracement levels and future areas of support or resistance following significant price moves. The arcs are drawn using a trend line between two points, typically a significant high and low, and then plot arcs intersecting the trend line at Fibonacci levels of 23.6%, 38.2%, 50%, 61.8%, and 100%.

How to Use Fibonacci Arcs on MT (MetaTrader) Platform:

  1. Open MetaTrader: Launch your MetaTrader platform (MT4 or MT5).
  2. Select the Chart: Choose the financial instrument (e.g., currency pair, stock, commodity) and the time frame you want to analyze.
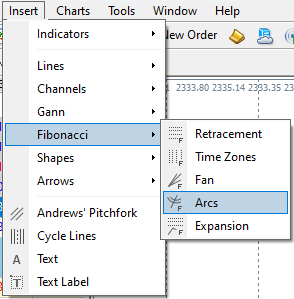
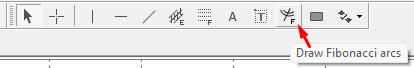
  3. Insert Fibonacci Arcs: Go to the toolbar and find the “Insert” menu. Select “Fibonacci” from the dropdown menu. Choose “Arcs” from the Fibonacci tools.
  4. Identify Key Points: Determine the significant high and low points you will use to draw the Fibonacci Arcs. This could be a recent swing high and swing low or any other significant price movement.
q3.png

q4.png
  1. Benefits of Using Fibonacci Arcs in Forex Trading:
  2. Visual Clarity: Fibonacci Arcs provide a clear visual representation of potential support and resistance levels, making it easier for traders to spot key price areas on the chart.
  3. Predictive Power: The arcs are based on the Fibonacci sequence, which is widely regarded as a natural and powerful tool for predicting market behavior.
  4. Versatility: Fibonacci Arcs can be applied to any timeframe and currency pair, making them a versatile tool for both short-term and long-term traders.
  5. Subjectivity: The effectiveness of Fibonacci Arcs can vary depending on how the trendline is drawn and which Fibonacci levels are used. Different traders might interpret the same price action differently.
  6. Not Foolproof: While Fibonacci Arcs can be helpful in identifying potential support and resistance levels, they should not be used in isolation. Market conditions can change rapidly, and relying solely on Fibonacci Arcs may lead to missed opportunities or false signals.

Fibonacci Arcs are a valuable tool for forex traders looking to identify potential support and resistance levels in the market. By understanding how to draw and analyze these arcs, traders can gain insights into where the market might reverse or continue, helping them make more informed trading decisions. However, like any technical tool, Fibonacci Arcs are most effective when used in combination with other indicators and sound risk management practices. As with any trading strategy, practice and experience are key to mastering the use of Fibonacci Arcs in forex trading.

footer new.jpeg

Risk Warning and Disclaimer

The market carries risks, and investment should be cautious. This article does not constitute personal investment advice and has not taken into account individual users' specific investment goals, financial situations, or needs. Users should consider whether any opinions, viewpoints, or conclusions in this article are suitable for their particular circumstances. Investing based on this is at one's own responsibility.

The End
Previous
Next
Comments
0/1000
TraderKnows India
Written byTraderKnows India
Created date:2024-08-27 20:01
Last Updated:2024-08-28 02:35
Independent Analysis: Manually researched and fact-checked by the TraderKnows Compliance Team, based on public regulatory records.
Wiki
Technical Analysis

Technical Analysis is a financial market analysis method that predicts future price trends by statistically and graphically analyzing historical data such as prices, trading volumes, and indicators.

Organization

Active

TraderKnowsTraderKnows
Recent Post

Trump Invokes Defense Production Act with 850 Million USD for Coal Power to Meet AI Demand

06-05

NY Fed Index Shows High Supply Chain Pressures as Geopolitical Conflicts Raise Global Inflation Con…

06-05

Japan's Real Wages Rise for Fourth Consecutive Month, Fueling June BOJ Rate Hike Bets

06-05

China Flexible Employment Exceeds 300 Million as Blue-Collar Wage Growth Outpaces White-Collar for…

06-05

South Korean Stocks Post Steepest Weekly Drop Since March as Tech Valuations Reset

06-05

China Commercial Paper Rates Drop in Early June Amid Rising Bank Demand

06-05

UK House Prices Unexpectedly Fall in May as Geopolitical Tensions Push Up Borrowing Costs

06-05

Massive Intervention Fails to Save Yen as Short Positions Surge Near Historic Lows

06-05

AI Momentum Pauses as Broadcom Outlook Misses High Expectations; Markets Await Payrolls

06-05

SpaceX Launches 75B USD IPO Roadshow as Access Blocked in Mainland China and Hong Kong

06-05

Global Gold ETFs See $2 Billion Outflows in May as Capital Pivots to Tech Assets

06-05

Nikkei Drops Over 1% on Tech Sector Pullback While Real Wage Growth Provides Support

06-05

South Korea Lifts Mandatory Reporting for Crypto Transfers Over 10M Won

06-05

Amundi Says Asian AI Stocks Supported by Fundamentals as Fed Path Poses Key Risk

06-05

Taiwan Stocks Close 1.33% Lower on Broadcom Drop But Hold Key Technical Support

06-05

Risk Warning

TraderKnows is a financial media platform, with information displayed coming from public networks or uploaded by users. TraderKnows does not endorse any trading platform or variety. We bear no responsibility for any trading disputes or losses arising from the use of this information. Please be aware that displayed information may be delayed, and users should independently verify it to ensure its accuracy.