View the market insights of the Global Research Department at the Trading Center today. Explore new trading methods and opportunities from popular trading products.
EUR/USD GBP/USD Gold Spot EUR/JPY EUR/GBP USD/CHF Germany DAX Index Futures (Eurex) Brent Crude (ICE) UK FTSE 100 Index Futures
Kind reminder: Due to market fluctuations, prices may have crossed key points, rendering strategies ineffective.
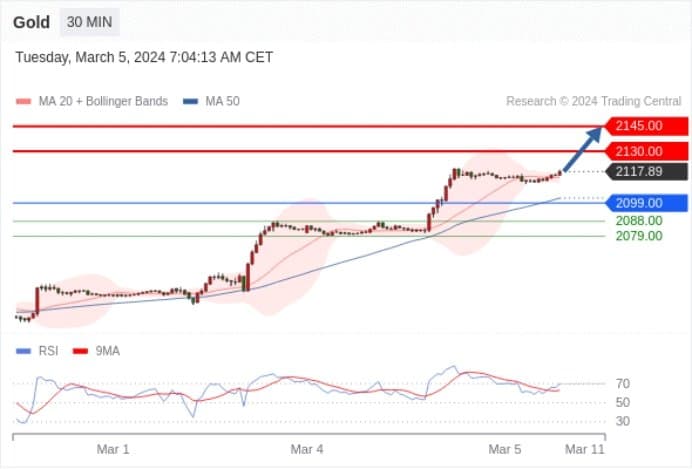
Gold Spot Today: Expecting 2130.00.
Pivot Point:
2099.00
Trading Strategy:
Above 2099.00, bullish with a target price of 2130.00, followed by 2145.00.
Alternative Strategy:
Below 2099.00, bearish with a target price of 2088.00, followed by 2079.00.
Technical Review:
Above 2099.00, a bullish signal with an upward target of 2130.00.
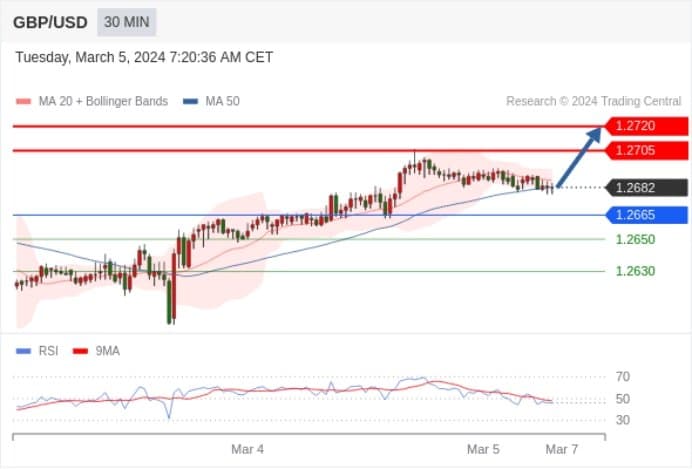
GBP/USD Today: Bullish.
Pivot Point:
1.2665
Trading Strategy:
Above 1.2665, bullish with a target price of 1.2705, followed by 1.2720.
Alternative Strategy:
Below 1.2665, bearish with a target price of 1.2650, followed by 1.2630.
Technical Review:
Even though we can't rule out the possibility of continued adjustment, its duration should be limited.
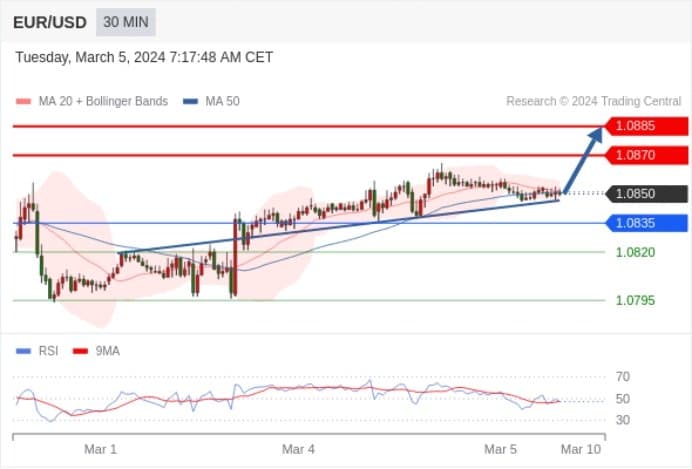
EUR/USD Today: Bullish above 1.0835.
Pivot Point:
1.0835
Trading Strategy:
Above 1.0835, bullish with a target price of 1.0870, followed by 1.0885.
Alternative Strategy:
Below 1.0835, bearish with a target price of 1.0820, followed by 1.0795.
Technical Review:
RSI indicator lacks downward momentum
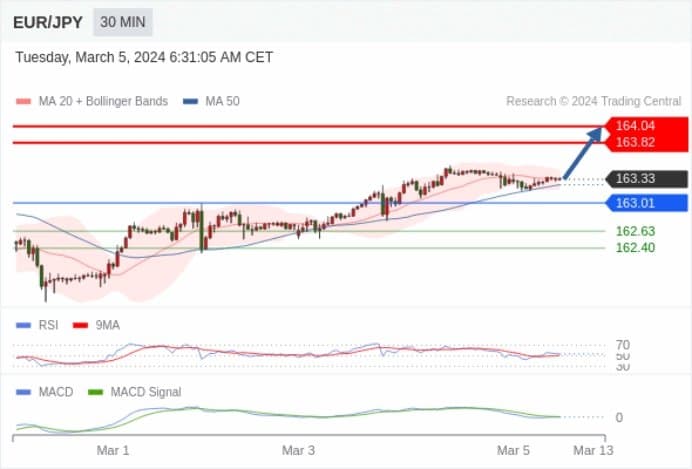
EUR/JPY Today: Bullish, with 163.01 as support, targeting 164.04.
163.01 as the pivot point.
Trading Strategy:
Bullish, with 163.01 as support, targeting 164.04.
Alternative Strategy:
A breakdown below 163.01 would indicate a continuing bearish trend, with target points at 162.63 and then 162.40.
Technical Review:
RSI indicator above the neutral zone of 50. MACD indicator is bullish as it resides below its signal line. Additionally, prices are above their 20-day and 50-day moving averages (currently at 163.32 and 163.25).
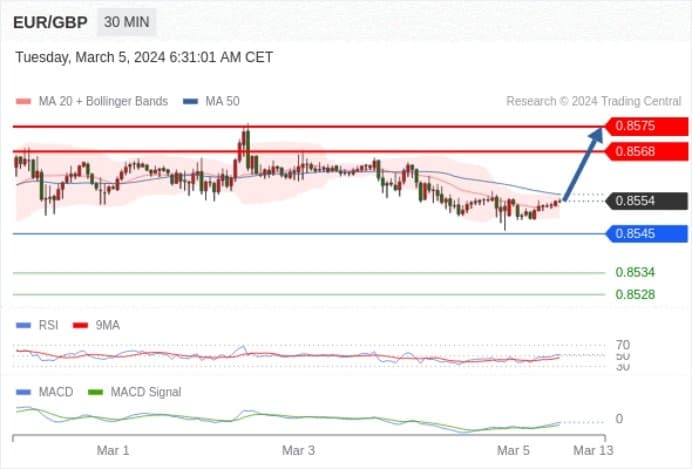
EUR/GBP Today: Bullish.
Pivot Point:
0.8545
Trading Strategy:
Bullish.
Alternative Strategy:
A fall below 0.8545 would indicate a continuing downward trend, with target points at 0.8534 and then 0.8528.
Technical Review:
RSI indicator above the neutral zone of 50. MACD indicator is bearish and resides above its signal line. Additionally, the price is below its 50-day moving average (0.8556) but above its 20-day moving average (0.8553).
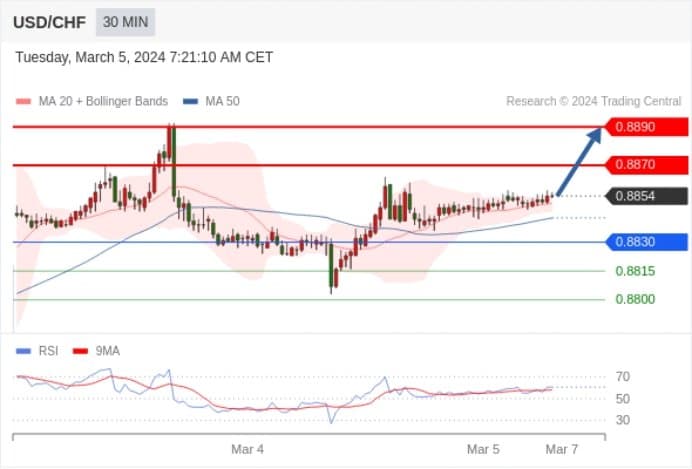
USD/CHF Today: An uptrend.
Pivot Point:
0.8830
Trading Strategy:
Above 0.8830, bullish with a target price of 0.8870, followed by 0.8890.
Alternative Strategy:
Below 0.8830, bearish with a target price of 0.8815, followed by 0.8800.
Technical Review:
RSI indicator trending upwards.
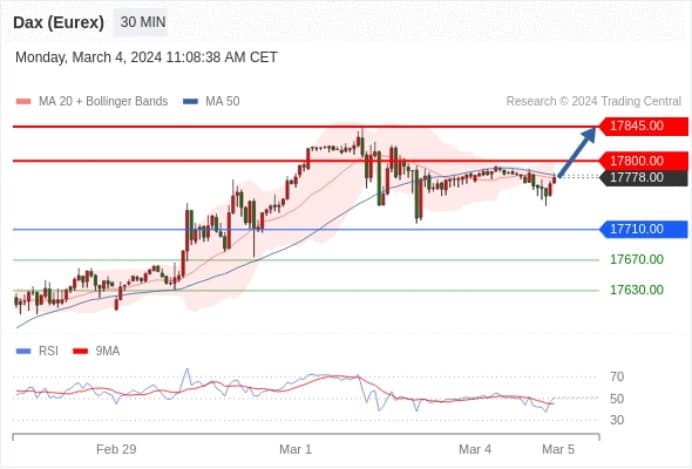
Germany DAX Index Futures (Eurex) (H4) Today: Bullish.
Pivot Point:
17710.00
Trading Strategy:
Above 17710.00, bullish with a target price of 17800.00, followed by 17845.00.
Alternative Strategy:
Below 17710.00, bearish with a target price of 17670.00, followed by 17630.00.
Technical Review:
Even though we can't rule out the possibility of continued adjustment, its duration should be limited.
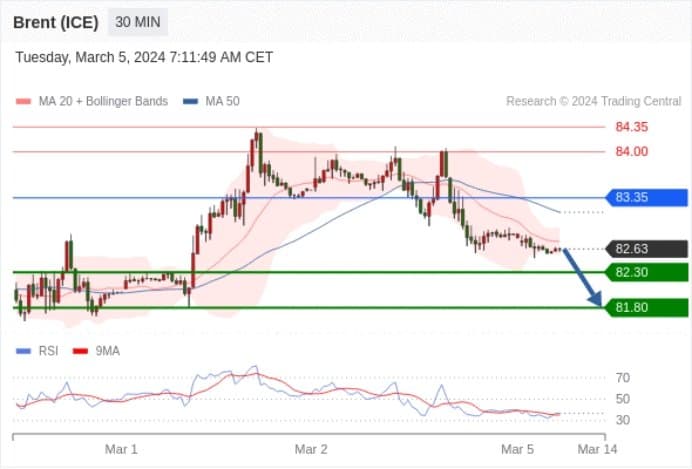
Brent Crude (ICE) (K4) Today: Under pressure.
Pivot Point:
83.35
Trading Strategy:
Below 83.35, bearish with a target price of 82.30, followed by 81.80.
Alternative Strategy:
Above 83.35, bullish with a target price of 84.00, followed by 84.35.
Technical Review:
RSI indicator is bearish with further room to move down.
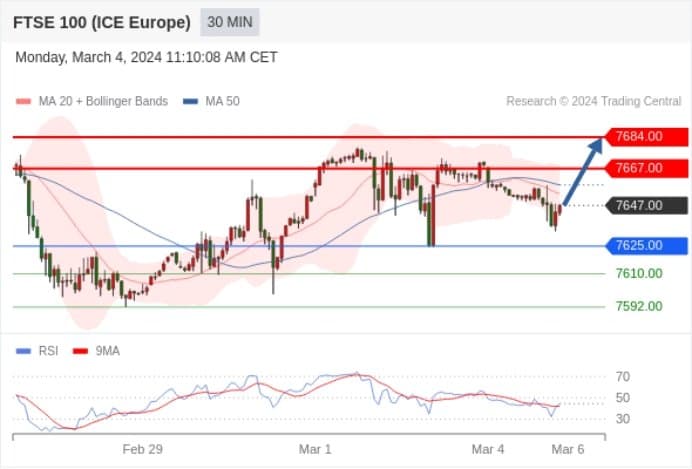
UK FTSE 100 Index Futures Today: Very short-term (Intraday) support around 7625.00.
Pivot Point:
7625.00
Trading Strategy:
Above 7625.00, bullish with a target price of 7667.00, followed by 7684.00.
Alternative Strategy:
Below 7625.00, bearish with a target price of 7610.00, followed by 7592.00.
Technical Review:
The trend of the RSI indicator is complex, and caution is advised.