Check out the market views of the Global Research department at the Trading Center today. Explore new trading methods and opportunities from popular trading products.
EUR/USD Spot Gold GBP/USD EUR/JPY EUR/GBP USD/CHF German DAX Index Futures (Eurex) Brent Crude Oil (ICE) UK FTSE 100 Index Futures
Kind reminder: Due to market volatility, prices may have crossed key levels, rendering strategies ineffective.
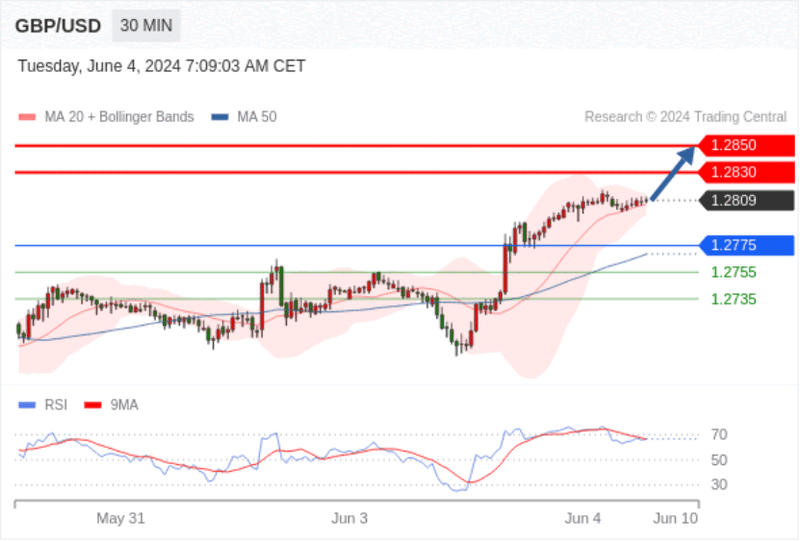
GBP/USD Intraday: Bullish above 1.2775.
Pivot point:
1.2775
Trading strategy:
Bullish above 1.2775 with target price at 1.2830, then 1.2850.
Alternate strategy:
Bearish below 1.2775, target price set at 1.2755, then 1.2735.
Technical commentary:
Above 1.2775 is a bullish signal with an upward target of 1.2830.
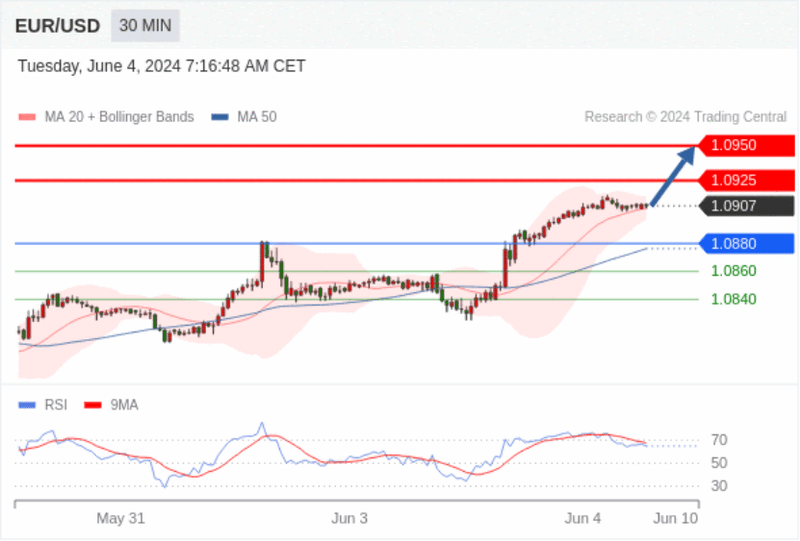
EUR/USD Intraday: Bullish above 1.0880.
Pivot point:
1.0880
Trading strategy:
Bullish above 1.0880 with target price at 1.0925, then 1.0950.
Alternate strategy:
Bearish below 1.0880, target price set at 1.0860, then 1.0840.
Technical commentary:
Above 1.0880 is a bullish signal with an upward target of 1.0925.
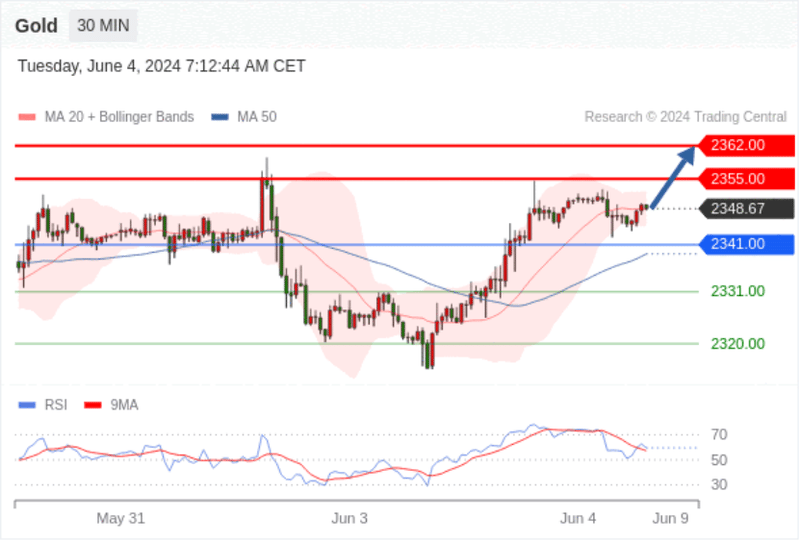
Spot Gold Intraday: Bullish above 2341.00.
Pivot point:
2341.00
Trading strategy:
Bullish above 2341.00 with target price at 2355.00, then 2362.00.
Alternate strategy:
Bearish below 2341.00, target price set at 2331.00, then 2320.00.
Technical commentary:
RSI technical indicator above the 50% neutral zone.
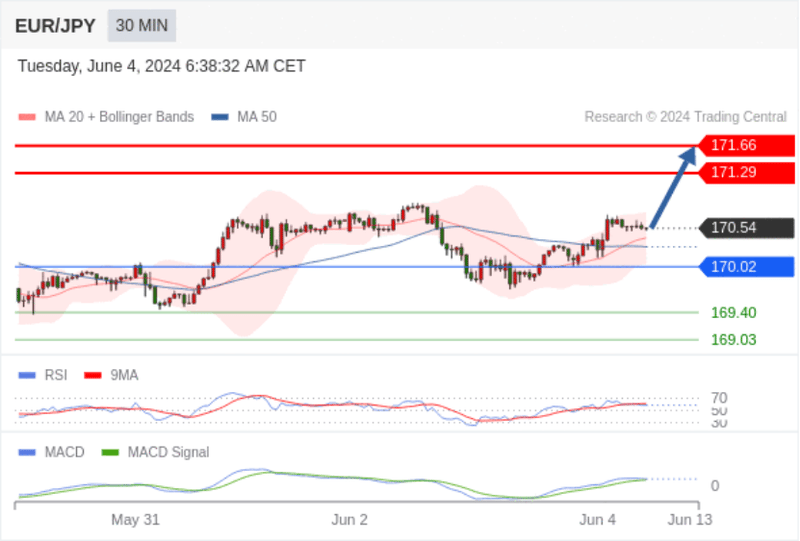
EUR/JPY Intraday: Bullish, as 170.02 serves as support.
170.02 as the pivot point.
Trading strategy:
Bullish, using 170.02 as support.
Alternate strategy:
A break below 170.02 will bring a downward trend, targeting 169.40 and then 169.03.
Technical commentary:
RSI technical indicator above the 50% neutral zone. MACD technical indicator is above its signal line. In addition, the price is above its 20-day and 50-day moving averages (170.41 and 170.29, respectively).
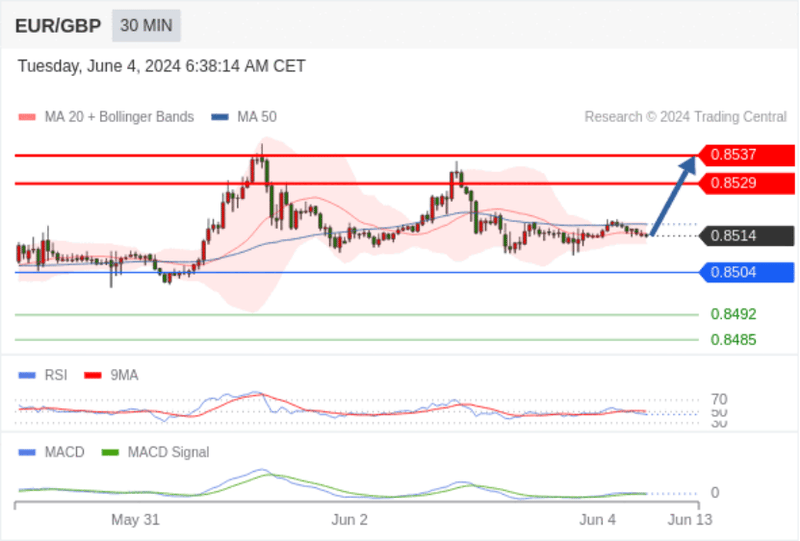
EUR/GBP Intraday: Potential for upward movement, target price set at 0.8537.
Pivot point:
0.8504
Trading strategy:
Potential for upward movement, target price set at 0.8537.
Alternate strategy:
If it breaks below 0.8504, EUR/GBP targets 0.8492 and 0.8485.
Technical commentary:
RSI technical indicator below 50. MACD technical indicator shows a bearish state and is above its signal line. Additionally, the price is below its 20-day and 50-day moving averages (0.8515 and 0.8518, respectively).
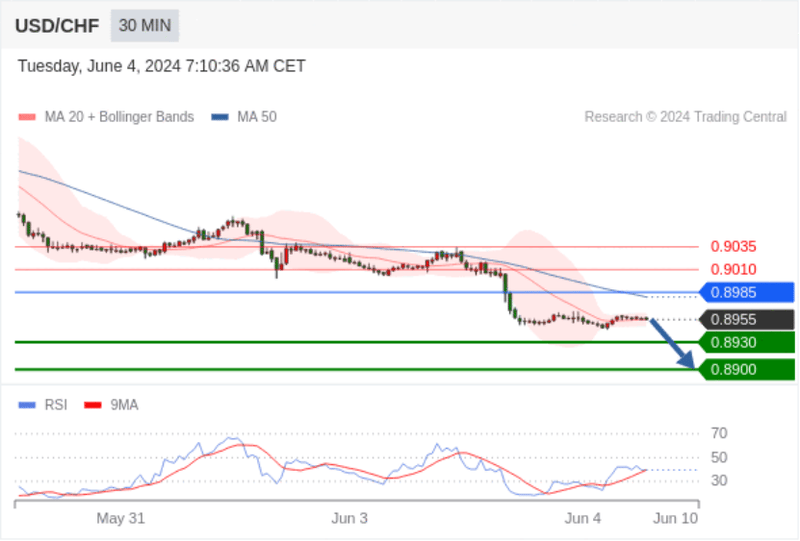
USD/CHF Intraday: Under pressure.
Pivot point:
0.8985
Trading strategy:
Bearish below 0.8985, target price at 0.8930, then 0.8900.
Alternate strategy:
Bullish above 0.8985, target price set at 0.9010, then 0.9035.
Technical commentary:
As long as the 0.8985 resistance exists, the price fluctuations have a bearish trend.
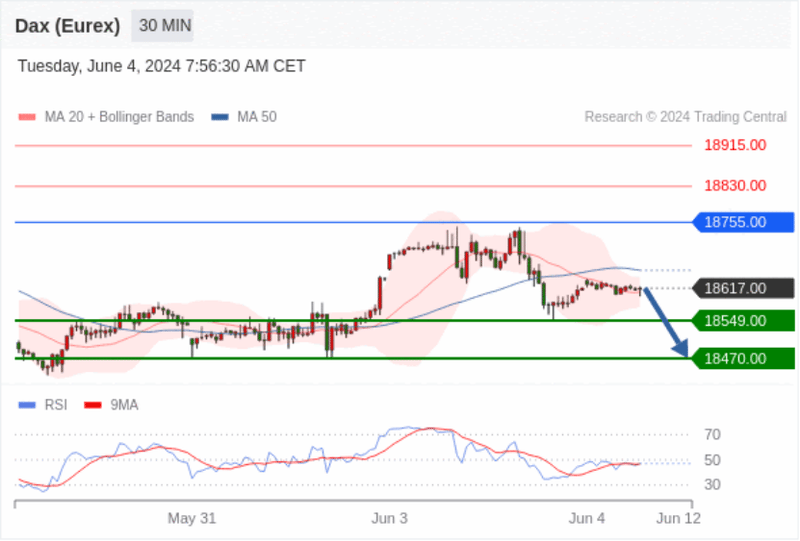
German DAX Index Futures (Eurex) Intraday: No clear trend.
Pivot point:
18755.00
Trading strategy:
Bearish below 18755.00, target price at 18549.00, then 18470.00.
Alternate strategy:
Bullish above 18755.00, target price set at 18830.00, then 18915.00.
Technical commentary:
As long as the 18755.00 resistance exists, the price fluctuations have a bearish trend.
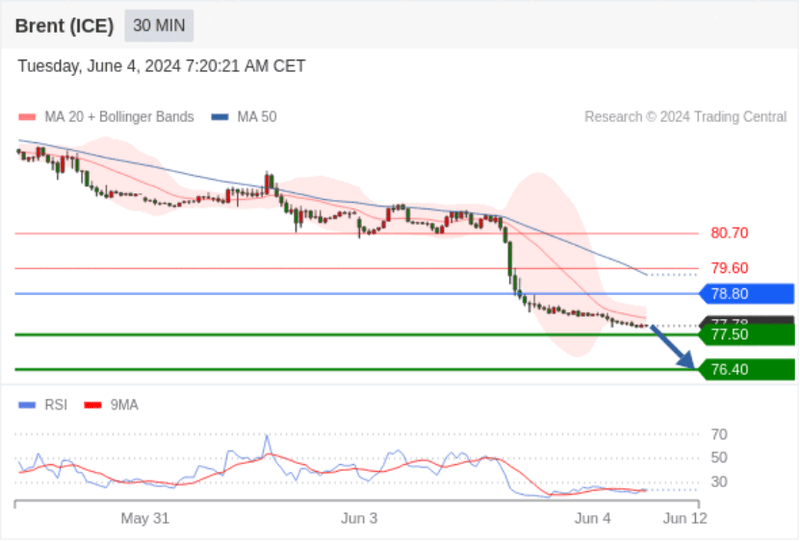
Brent Crude Oil (ICE) Intraday: Under pressure.
Pivot point:
78.80
Trading strategy:
Bearish below 78.80, target price at 77.50, then 76.40.
Alternate strategy:
Bullish above 78.80, target price set at 79.60, then 80.70.
Technical commentary:
RSI technical indicator below the 30 mark.
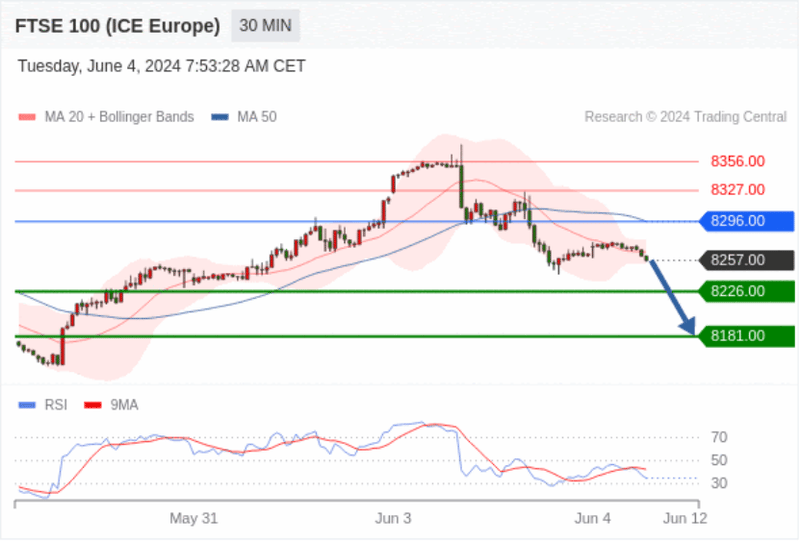
UK FTSE 100 Index Futures Intraday: Under pressure.
Pivot point:
8296.00
Trading strategy:
Bearish below 8296.00, target price at 8226.00, then 8181.00.
Alternate strategy:
Bullish above 8296.00, target price set at 8327.00, then 8356.00.
Technical commentary:
RSI technical indicator bearish, with a further downward trend.