Explore the latest market perspectives from the Global Research Department of the Trading Center. Discover new trading methods and opportunities from popular trading products.
EUR/USD GBP/USD Spot Gold EUR/JPY EUR/GBP USD/CHF Germany DAX Index Futures (Eurex) Brent Crude (ICE) UK FTSE 100 Index Futures
Kind reminder: Due to market volatility, prices may have already moved beyond key levels, rendering strategies ineffective.
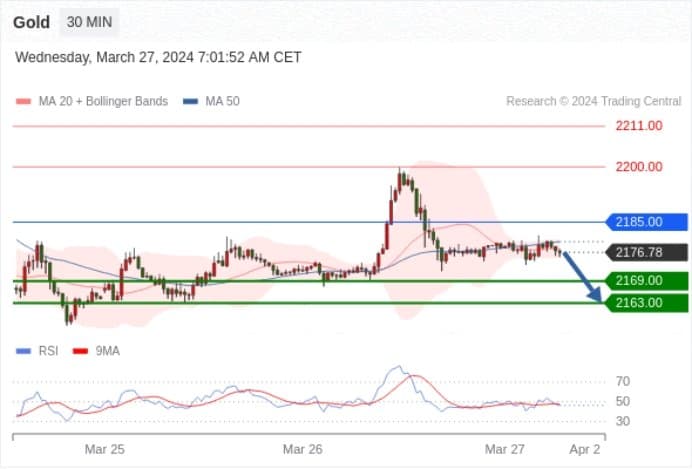
Spot Gold Today: Under Pressure.
Pivot Point:
2185.00
Trading Strategy:
Bearish below 2185.00, target levels at 2169.00, then 2163.00.
Alternative Strategy:
Bullish above 2185.00, target levels at 2200.00, then 2211.00.
Technical Commentary:
As long as resistance at 2185.00 holds, expect a bearish trend in price fluctuations.
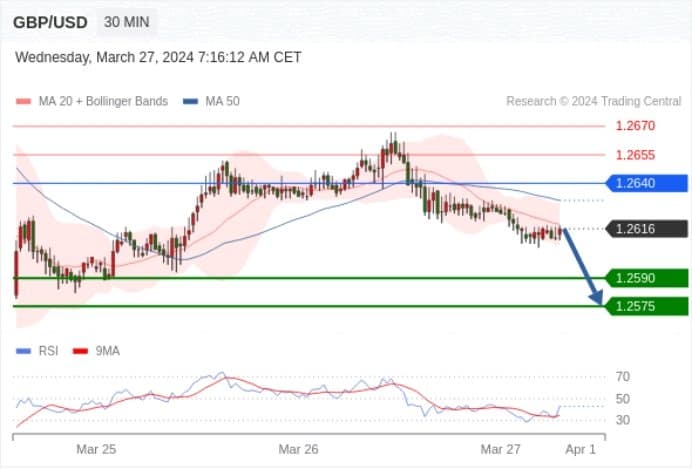
GBP/USD Today: Under Pressure.
Pivot Point:
1.2640
Trading Strategy:
Bearish below 1.2640, target levels at 1.2590, then 1.2575.
Alternative Strategy:
Bullish above 1.2640, target levels at 1.2655, then 1.2670.
Technical Commentary:
The RSI indicator trends are complex, leaning towards a decline.
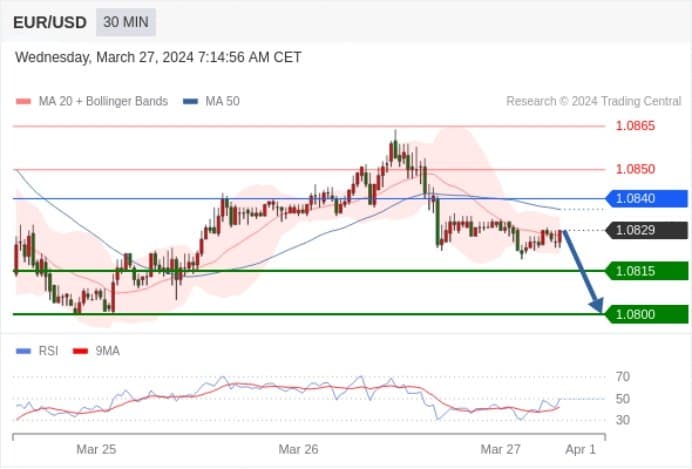
EUR/USD Today: Under Pressure.
Pivot Point:
1.0840
Trading Strategy:
Bearish below 1.0840, target levels at 1.0815, then 1.0800.
Alternative Strategy:
Bullish above 1.0840, target levels at 1.0850, then 1.0865.
Technical Commentary:
The RSI indicator lacks upward momentum.
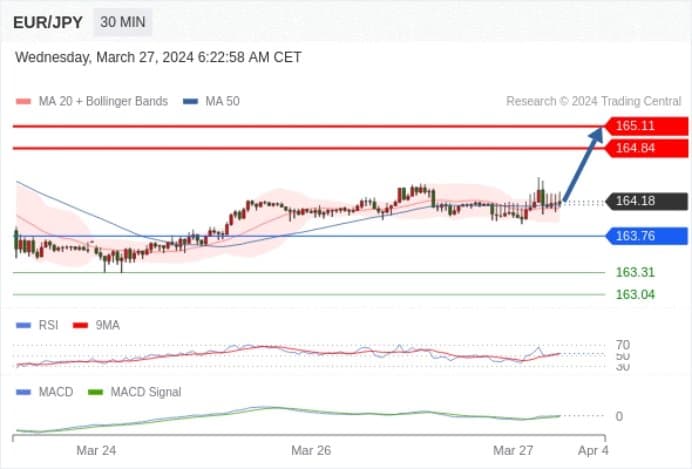
EUR/JPY Today: Bullish with 163.76 as support.
163.76 as Pivot Point.
Trading Strategy:
Bullish with 163.76 as support.
Alternative Strategy:
If it breaks below 163.76, target EUR/JPY direction at 163.31 and 163.04.
Technical Commentary :
The RSI indicator is above the neutral 50 area. The MACD indicator is bullish and above its signal line. Moreover, prices are above their 20-day and 50-day moving averages (currently at 164.10 and 164.14).
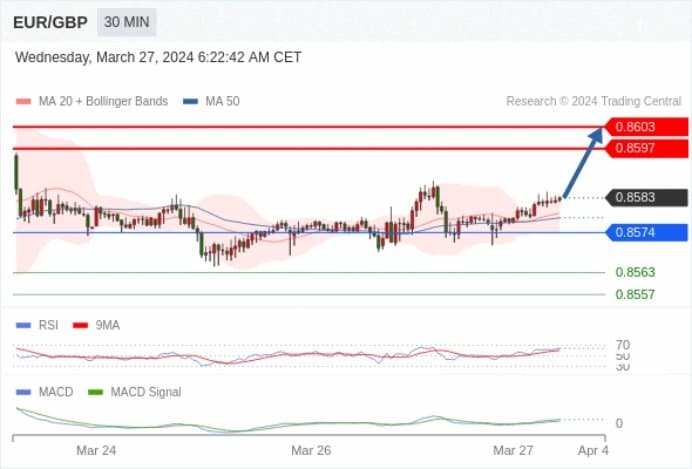
EUR/GBP Today: Bullish with 0.8574 as support.
0.8574 as Pivot Point.
Trading Strategy:
Bullish with 0.8574 as support.
Alternative Strategy:
If it breaks below 0.8574, the trend will continue to decline, with target levels at 0.8563 and then 0.8557.
Technical Commentary :
The RSI indicator is above 50. The MACD indicator is bullish and above its signal line. Moreover, prices are above their 20-day and 50-day moving averages (currently at 0.8579 and 0.8578).
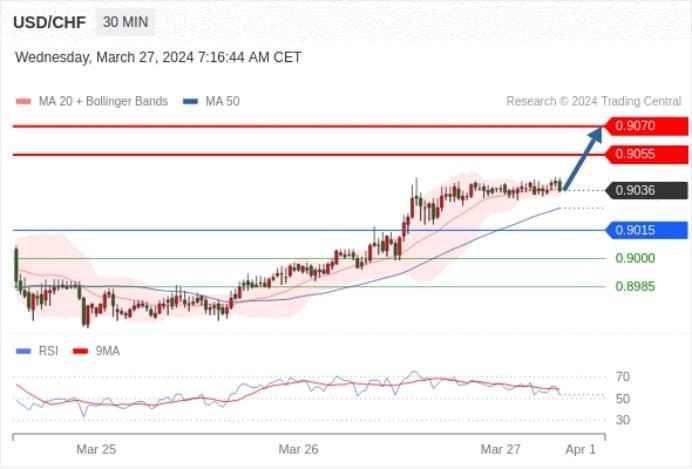
USD/CHF Today: Upward Trend.
Pivot Point:
0.9015
Trading Strategy:
Bullish above 0.9015, target levels at 0.9055, then 0.9070.
Alternative Strategy:
Bearish below 0.9015, target levels at 0.9000, then 0.8985.
Technical Commentary:
The RSI indicator trends are complex, leaning towards a rise.
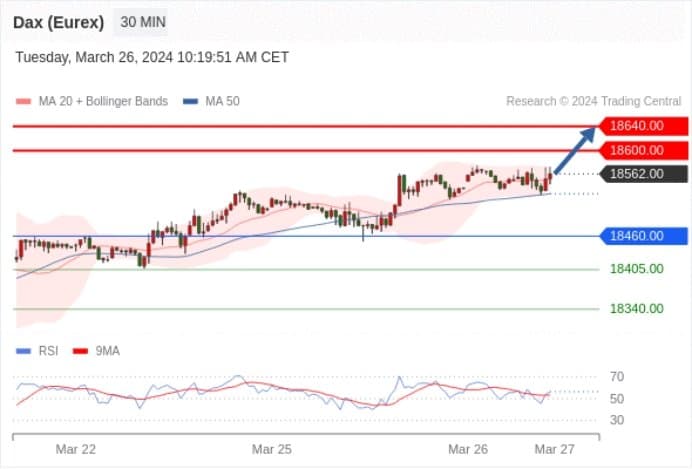
Germany DAX Index Futures (Eurex) (M4) Today: Upward Trend.
Pivot Point:
18460.00
Trading Strategy:
Bullish above 18460.00, target levels at 18600.00, then 18640.00.
Alternative Strategy:
Bearish below 18460.00, target levels at 18405.00, then 18340.00.
Technical Commentary:
The RSI indicator is near the neutral 50% area.
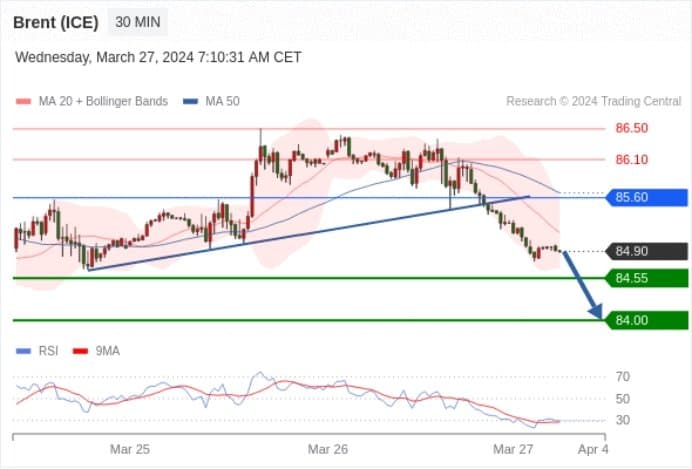
Brent Crude (ICE) (M4) Today: Under Pressure.
Pivot Point:
85.60
Trading Strategy:
Bearish below 85.60, target levels at 84.55, then 84.00.
Alternative Strategy:
Bullish above 85.60, target levels at 86.10, then 86.50.
Technical Commentary:
The RSI indicator has broken below its 30 position.
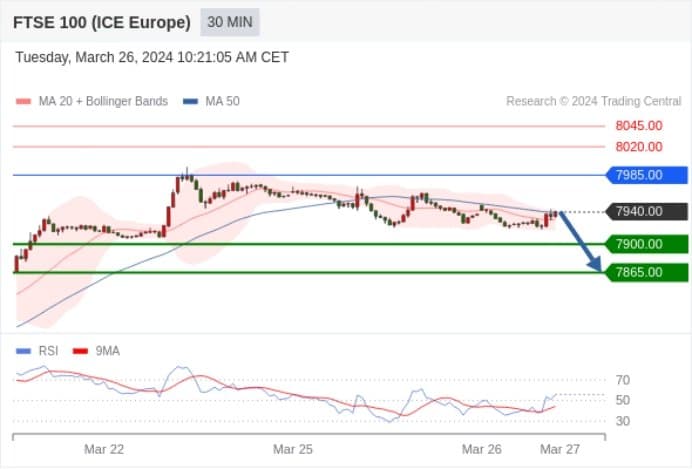
UK FTSE 100 Index Futures Today: Short-term Adjustment.
Pivot Point:
7985.00
Trading Strategy:
Bearish below 7985.00, target levels at 7900.00, then 7865.00.
Alternative Strategy:
Bullish above 7985.00, target levels at 8020.00, then 8045.00.
Technical Commentary:
As long as resistance at 7985.00 holds, expect a bearish trend in price fluctuations.