Explore today's market perspectives from the Global Research Department of the Transaction Center. Discover new trading methods and opportunities from popular trading products.
EUR/USD GBP/USD Spot Gold EUR/JPY EUR/GBP USD/CHF Germany DAX Index Futures (Eurex) Brent Crude Oil (ICE) UK FTSE 100 Index Futures
Friendly reminder: Due to market volatility, prices may have moved past key points, rendering strategies ineffective.
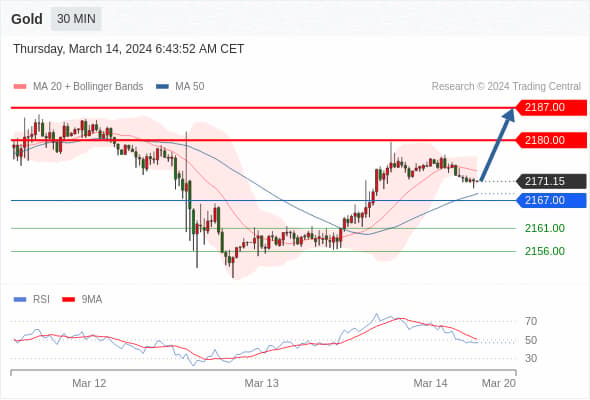
Spot Gold Today: Bullish above 2167.00.
Pivot Point:
2167.00
Trading Strategy:
Bullish above 2167.00, targeting 2180.00, then 2187.00.
Alternative Strategy:
Bearish below 2167.00, targeting 2161.00, then 2156.00.
Technical Commentary:
The RSI indicator shows a complicated trend leaning towards an upward movement.
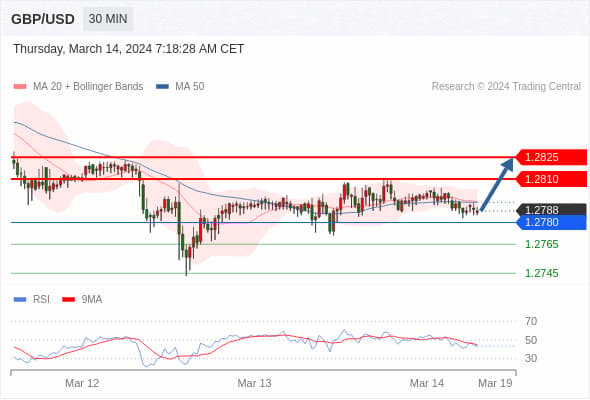
GBP/USD Today: Bullish above 1.2780.
Pivot Point:
1.2780
Trading Strategy:
Bullish above 1.2780, targeting 1.2810, then 1.2825.
Alternative Strategy:
Bearish below 1.2780, targeting 1.2765, then 1.2745.
Technical Commentary:
Even though we cannot rule out the possibility of ongoing adjustments, their duration should be limited.
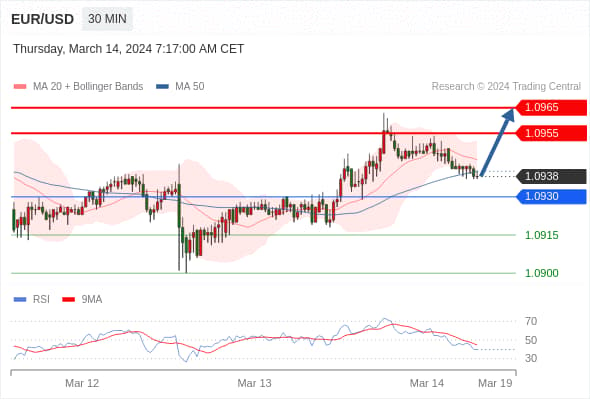
EUR/USD Today: Bullish above 1.0930.
Pivot Point:
1.0930
Trading Strategy:
Bullish above 1.0930, targeting 1.0955, then 1.0965.
Alternative Strategy:
Bearish below 1.0930, targeting 1.0915, then 1.0900.
Technical Commentary:
Even though we cannot rule out the possibility of ongoing adjustments, their duration should be limited.
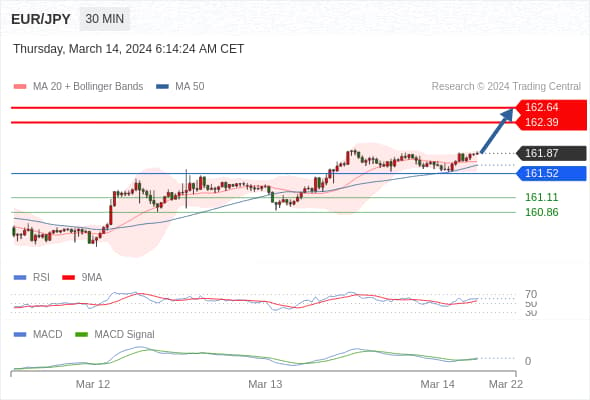
EUR/JPY Today: Bullish, with 161.52 as the support level.
161.52 as the pivot point.
Trading Strategy:
Bullish, with 161.52 as the support level.
Alternative Strategy:
A downward break through 161.52 will signal a continuing downtrend, targeting 161.11, then 160.86.
Technical Commentary:
The RSI indicator is above 50. The MACD indicator is bullish and above its signal line. Moreover, the price is above its 20-day and 50-day moving averages (located at 161.73 and 161.66, respectively).
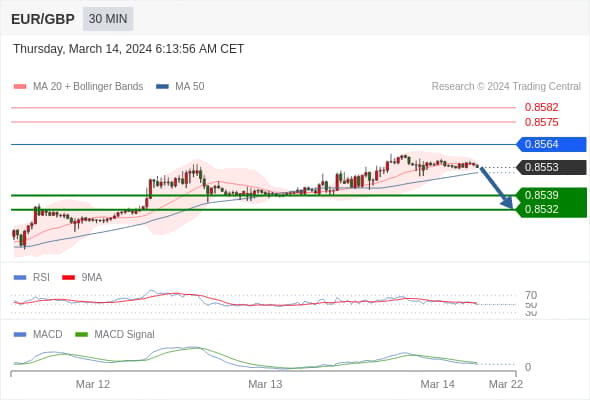
EUR/GBP Today: In a gradual downtrend with 0.8564 as an upward barrier, targeting 0.8532.
Pivot Point set at:
0.8564
Trading Strategy:
In a gradual downtrend with 0.8564 as an upward barrier, targeting 0.8532.
Alternative Strategy:
If it breaks through 0.8564, the target direction for EUR/GBP is 0.8575 and then 0.8582.
Technical Commentary:
The RSI indicator is below 50. The MACD indicator is bearish and below its signal line. In addition, the price is below its 20-day moving average (0.8554) but above its 50-day moving average (0.8550).
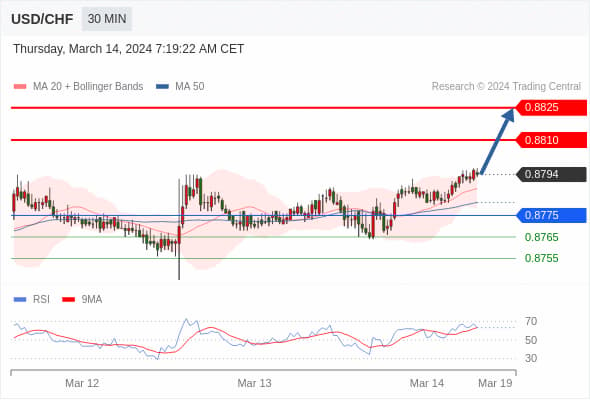
USD/CHF Today: Further upward movement expected.
Pivot Point:
0.8775
Trading Strategy:
Bullish above 0.8775, targeting 0.8810, then 0.8825.
Alternative Strategy:
Bearish below 0.8775, targeting 0.8765, then 0.8755.
Technical Commentary:
The RSI indicator shows a continuing upward trend.
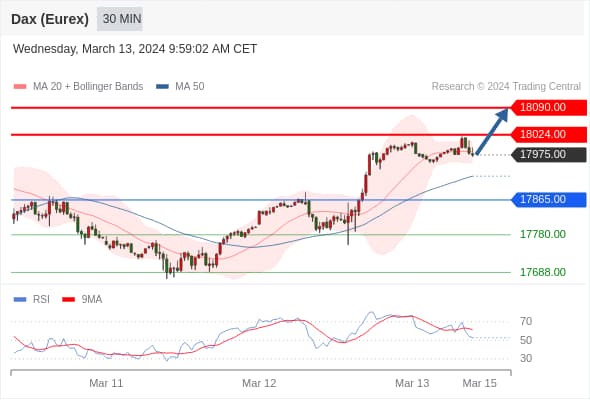
Germany DAX Index Futures (Eurex) (H4) Today: In an upward trend.
Pivot Point:
17865.00
Trading Strategy:
Bullish above 17865.00, targeting 18024.00, then 18090.00.
Alternative Strategy:
Bearish below 17865.00, targeting 17780.00, then 17688.00.
Technical Commentary:
Investors should remain cautious as these support or resistance levels may trigger profit-taking.
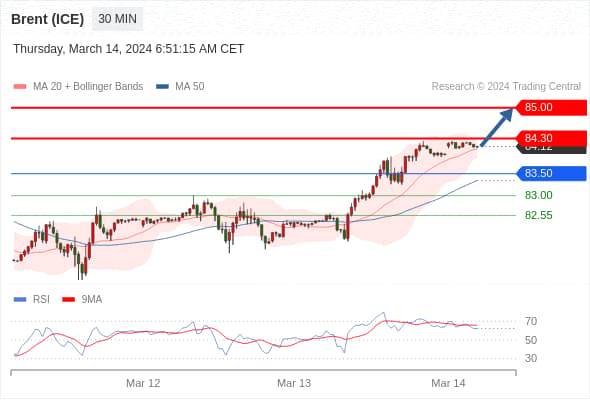
Brent Crude Oil (ICE) (K4) Today: Bullish above 83.50.
Pivot Point:
83.50
Trading Strategy:
Bullish above 83.50, targeting 84.30, then 85.00.
Alternative Strategy:
Bearish below 83.50, targeting 83.00, then 82.55.
Technical Commentary:
The RSI indicator shows a lack of downward momentum.
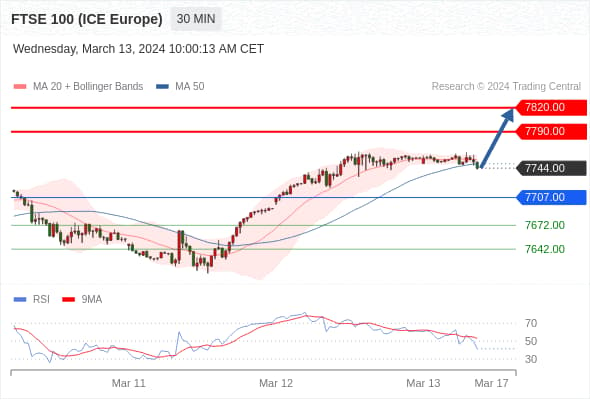
UK FTSE 100 Index Futures Today: In an upward trend.
Pivot Point:
7707.00
Trading Strategy:
Bullish above 7707.00, targeting 7790.00, then 7820.00.
Alternative Strategy:
Bearish below 7707.00, targeting 7672.00, then 7642.00.
Technical Commentary:
The RSI indicator shows a complicated trend.