Explore the market insights of the Global Research Department at the Trading Center today. Discover new trading methods and opportunities among popular trading products.
EUR/USD Spot Gold GBP/USD EUR/JPY EUR/GBP USD/CHF Germany DAX Index Futures (Eurex) Brent Crude Oil (ICE) UK FTSE 100 Index Futures
Kind Reminder: Due to market fluctuations, prices may have moved past key levels, rendering strategies invalid.
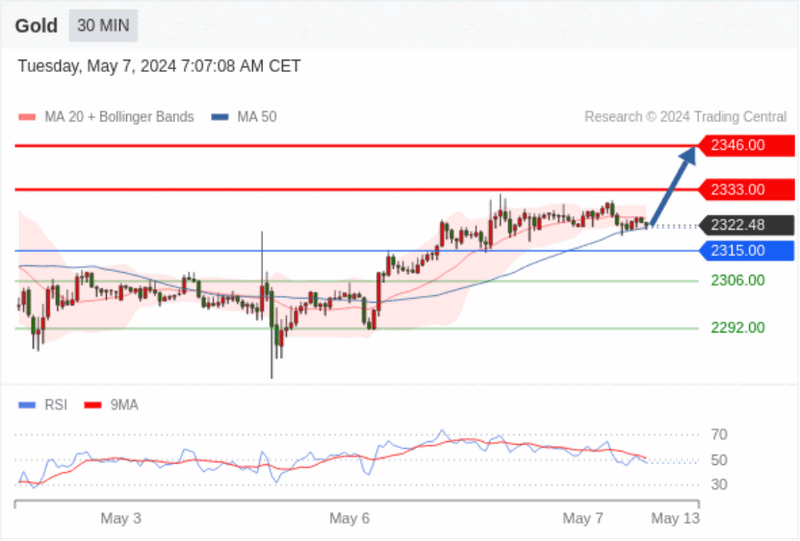
Spot Gold Today: A new round of upward movement.
Pivot Point:
2315.00
Trading Strategy:
Above 2315.00, go long with target prices at 2333.00, then 2346.00.
Alternative Strategy:
Below 2315.00, go short with target prices at 2306.00, then 2292.00.
Technical Commentary:
The RSI indicator shows a complex trend tendency, inclined towards rising.
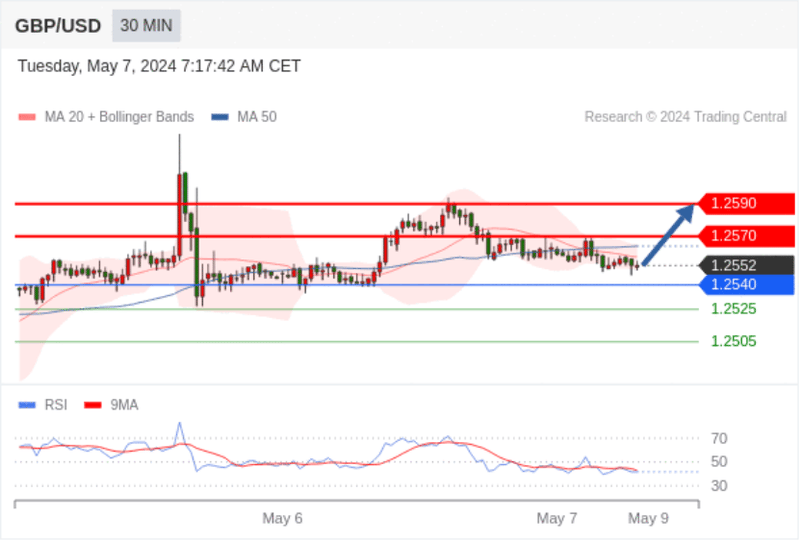
GBP/USD Today: Proceed with caution.
Pivot Point:
1.2540
Trading Strategy:
Above 1.2540, go long with target prices at 1.2570, then 1.2590.
Alternative Strategy:
Below 1.2540, go short with target prices at 1.2525, then 1.2505.
Technical Commentary:
The ultra-short-term (intraday) technical indicators show a complex trend, proceed with caution.
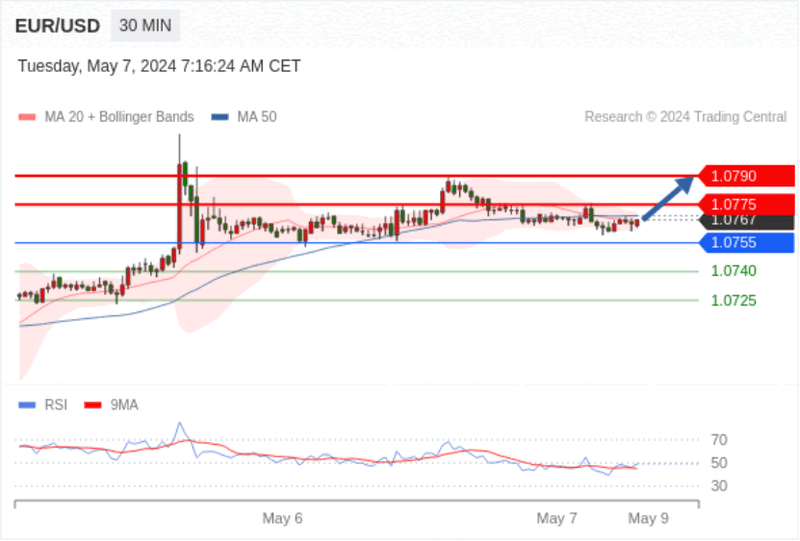
EUR/USD Today: Proceed with caution.
Pivot Point:
1.0755
Trading Strategy:
Above 1.0755, go long with target prices at 1.0775, then 1.0790.
Alternative Strategy:
Below 1.0755, go short with target prices at 1.0740, then 1.0725.
Technical Commentary:
The ultra-short-term (intraday) technical indicators show a complex trend, proceed with caution.
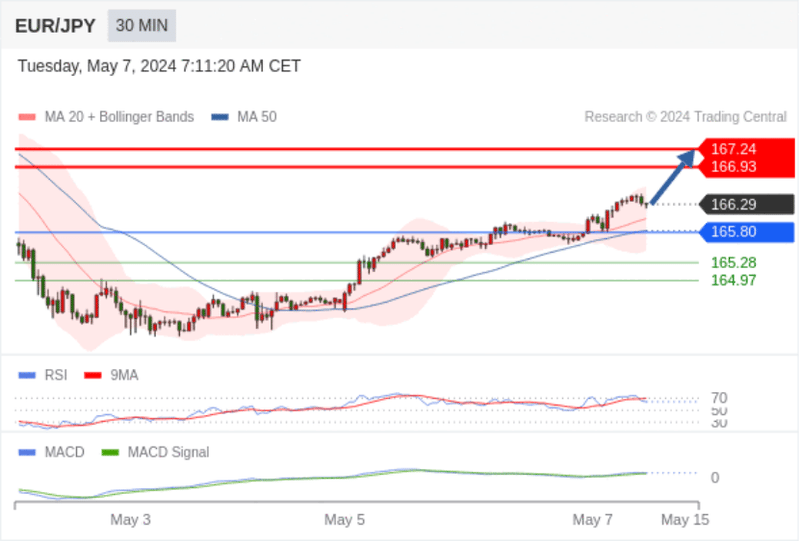
EUR/JPY Today: Bullish, with 165.80 as the support level.
165.80 as the Pivot Point.
Trading Strategy:
Bullish, with 165.80 as the support level.
Alternative Strategy:
If it falls below 165.80, target levels for EUR/JPY are set at 165.28 and 164.97.
Technical Commentary:
The RSI indicator is above the 50 neutral zone. The MACD indicator is bullish and above its signal line. Additionally, the price is above its 20-day and 50-day moving averages (currently at 166.04 and 165.83).
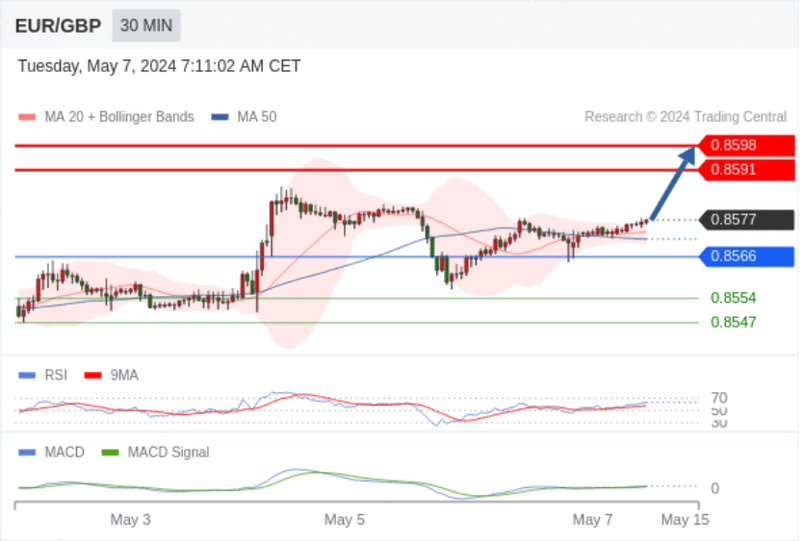
EUR/GBP Today: Bullish, with 0.8566 as the support level.
0.8566 as the Pivot Point.
Trading Strategy:
Bullish, with 0.8566 as the support level.
Alternative Strategy:
If it falls below 0.8566, target levels for EUR/GBP are set at 0.8554 and 0.8547.
Technical Commentary:
The RSI indicator is above 50. The MACD indicator is bullish and above its signal line. Additionally, the price is above its 20-day and 50-day moving averages (currently at 0.8573 and 0.8571).
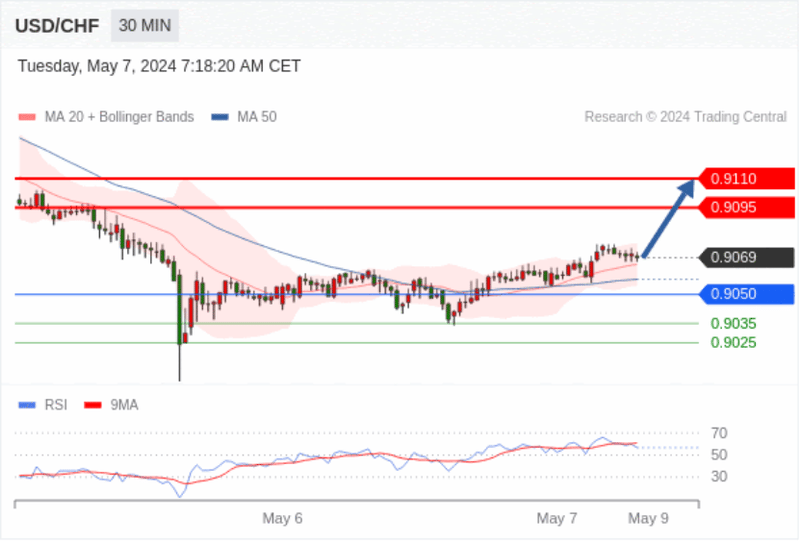
USD/CHF Today: An upward trend.
Pivot Point:
0.9050
Trading Strategy:
Above 0.9050, go long with target prices at 0.9095, then 0.9110.
Alternative Strategy:
Below 0.9050, go short with target prices at 0.9035, then 0.9025.
Technical Commentary:
The RSI indicator is trending upwards.
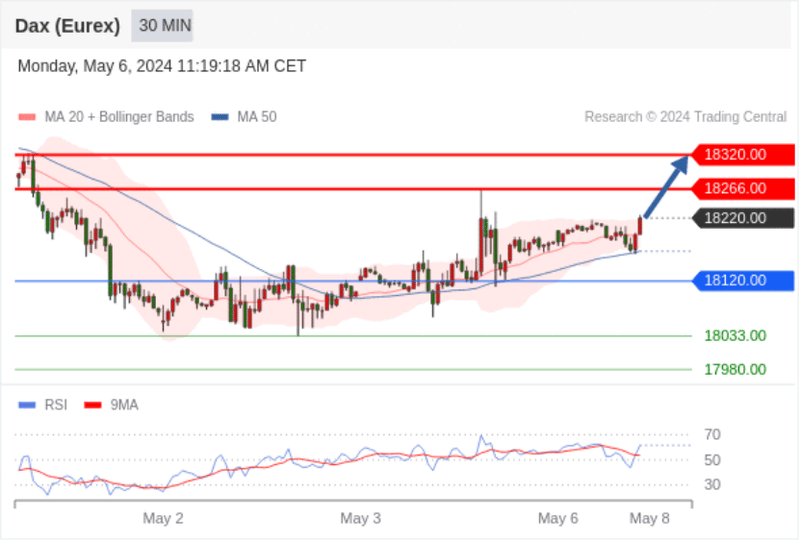
Germany DAX Index Futures (Eurex) (M4) Today: Ultra-short-term (intraday) support around 18120.00.
Pivot Point:
18120.00
Trading Strategy:
Above 18120.00, go long with target prices at 18266.00, then 18320.00.
Alternative Strategy:
Below 18120.00, go short with target prices at 18033.00, then 17980.00.
Technical Commentary:
The RSI indicator just reached the 50% neutral area and is turning upwards.
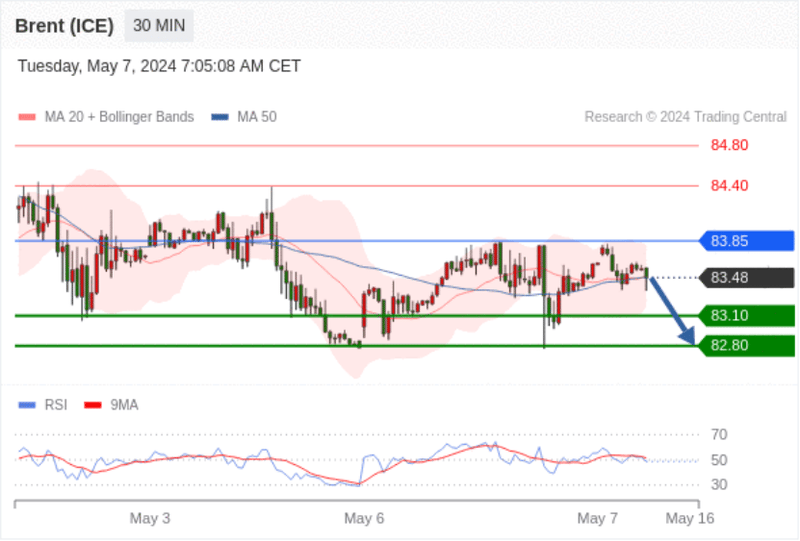
Brent Crude Oil (ICE) (N4) Today: No significant trend change.
Pivot Point:
83.85
Trading Strategy:
Below 83.85, go short with target prices at 83.10, then 82.80.
Alternative Strategy:
Above 83.85, go long with target prices at 84.40, then 84.80.
Technical Commentary:
As long as the resistance at 83.85 remains, there's a bearish trend in price fluctuations.
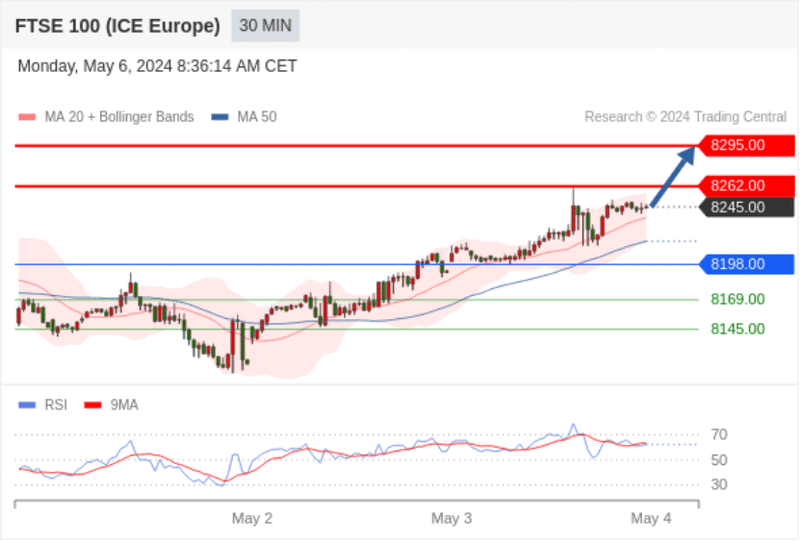
UK FTSE 100 Index Futures Today: A new upward move.
Pivot Point:
8198.00
Trading Strategy:
Above 8198.00, go long with target prices at 8262.00, then 8295.00.
Alternative Strategy:
Below 8198.00, go short with target prices at 8169.00, then 8145.00.
Technical Commentary:
The RSI indicator is bullish, indicating a further upward trend.