Explore the latest market insights from the Global Research Department of the Trading Center. Discover new trading methods and opportunities among popular trading products.
EUR/USD GBP/USD Spot Gold EUR/JPY EUR/GBP USD/CHF Germany DAX Index Futures (Eurex) Brent Crude (ICE) UK FTSE 100 Index Futures
Kind Reminder: Due to market fluctuations, prices may have surpassed key levels, rendering strategies ineffective.
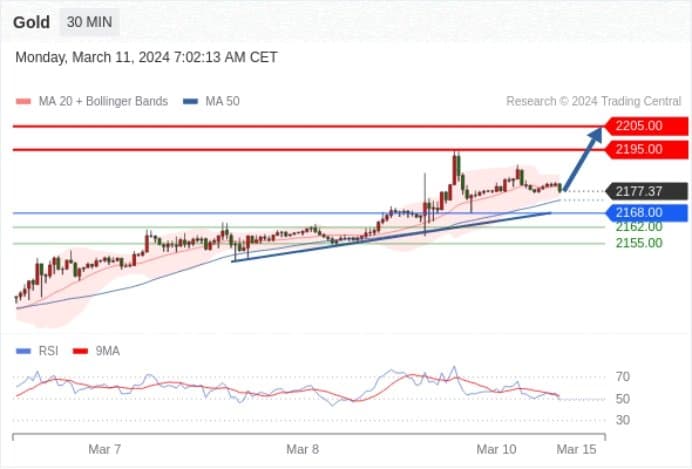
Spot Gold Today: Anticipated at 2205.00.
Pivot Point:
2168.00
Trading Strategy:
Above 2168.00, bullish, with target prices at 2195.00 and then 2205.00.
Alternative Strategy:
Below 2168.00, bearish, targeting 2162.00, followed by 2155.00.
Technical Commentary:
The RSI indicator shows a complex trend, leaning towards an uptrend.
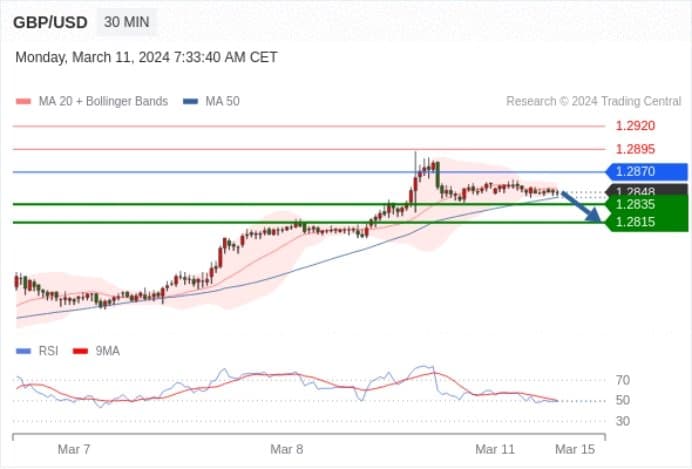
GBP/USD Today: Adjustments.
Pivot Point:
1.2870
Trading Strategy:
Below 1.2870, bearish, with target prices at 1.2835 and then 1.2815.
Alternative Strategy:
Above 1.2870, bullish, targeting 1.2895, followed by 1.2920.
Technical Commentary:
The RSI indicator shows a complex trend, leaning towards a downtrend.
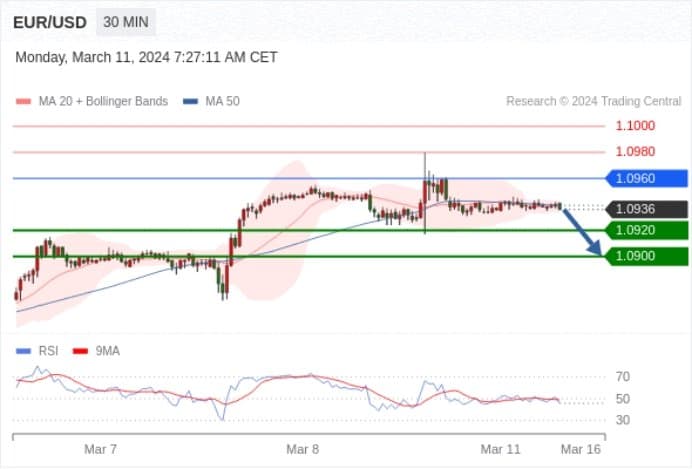
EUR/USD Today: Short-term key resistance at 1.0960.
Pivot Point:
1.0960
Trading Strategy:
Below 1.0960, bearish, with target prices at 1.0920 and then 1.0900.
Alternative Strategy:
Above 1.0960, bullish, targeting 1.0980, followed by 1.1000.
Technical Commentary:
As long as the 1.0960 resistance is not breached, the risk of falling below 1.0920 is high.
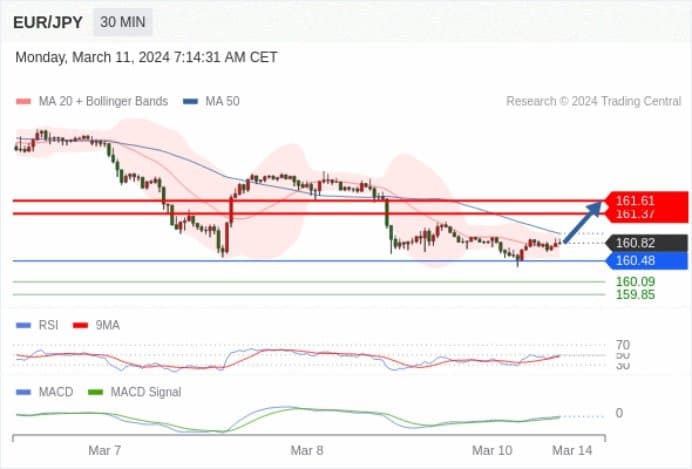
EUR/JPY Today: Potential for an uptrend, targeting 161.61.
Pivot Point:
160.48
Trading Strategy:
Possible uptrend, with a target at 161.61.
Alternative Strategy:
A fall below 160.48 could indicate a continuing downtrend, targeting 160.09 and then 159.85.
Technical Commentary:
The RSI is below the neutral 50 zone. The MACD is in a bearish state above its signal line. Prices are below their 50-day moving average (161) but above their 20-day moving average (160.75).
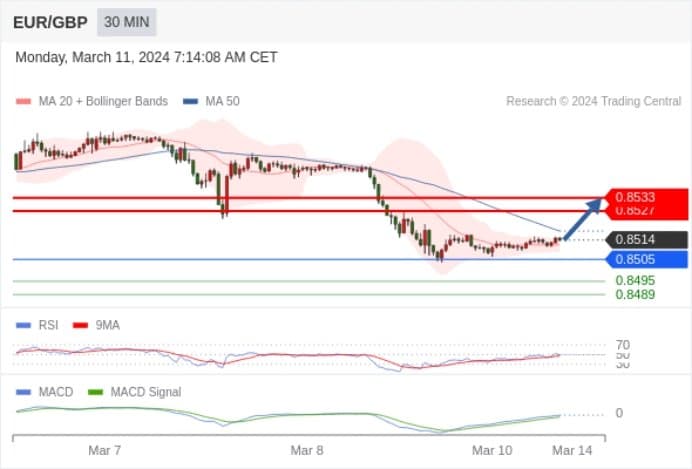
EUR/GBP Today: Potential for an uptrend, targeting 0.8533.
Pivot Point:
0.8505
Trading Strategy:
Possible uptrend, with a target at 0.8533.
Alternative Strategy:
A fall below 0.8505 could indicate a continuing downtrend, targeting 0.8495 and then 0.8489.
Technical Commentary:
The RSI is below 50. The MACD is in a bearish state above its signal line. Prices are below their 50-day moving average (0.8518) but above their 20-day moving average (0.8512).
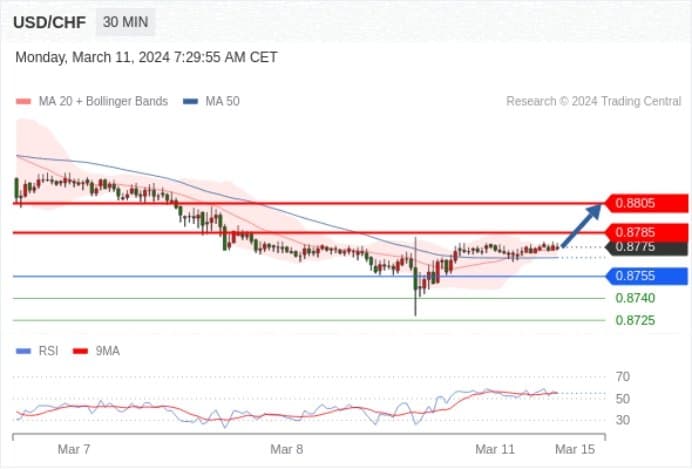
USD/CHF Today: Bullish above 0.8755.
Pivot Point:
0.8755
Trading Strategy:
Above 0.8755, bullish, with target prices at 0.8785 and then 0.8805.
Alternative Strategy:
Below 0.8755, bearish, targeting 0.8740, followed by 0.8725.
Technical Commentary:
The RSI indicator is trending upward.
Germany DAX Index Futures (Eurex) (H4) Today: Very short-term (intraday) support around 17800.00.
Pivot Point:
17800.00
Trading Strategy:
Above 17800.00, bullish, with target prices at 17880.00 and then 17920.00.
Alternative Strategy:
Below 17800.00, bearish, targeting 17760.00, followed by 17730.00.
Technical Commentary:
The RSI indicator shows a complex trend.

Brent Crude (ICE) (K4) Today: Under pressure.
Pivot Point:
82.10
Trading Strategy:
Below 82.10, bearish, with target prices at 81.00 and then 80.65.
Alternative Strategy:
Above 82.10, bullish, targeting 82.80, followed by 83.20.
Technical Commentary:
The RSI indicator is below the neutral 50% zone.

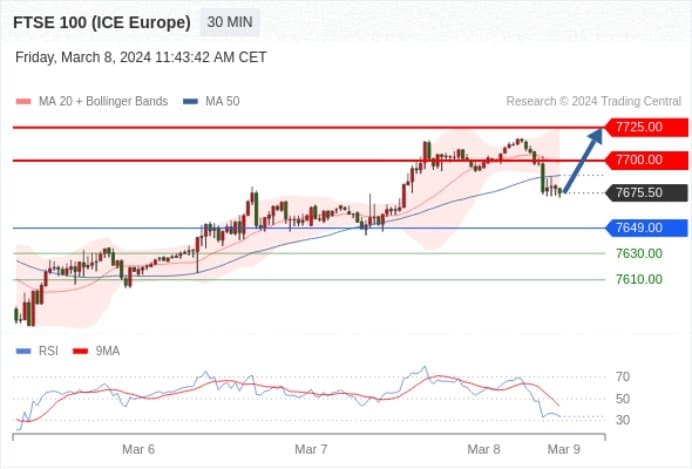
UK FTSE 100 Index Futures Today: Bullish above 7649.00.
Pivot Point:
7649.00
Trading Strategy:
Above 7649.00, bullish, with target prices at 7700.00 and then 7725.00.
Alternative Strategy:
Below 7649.00, bearish, targeting 7630.00, followed by 7610.00.
Technical Commentary:
The RSI indicator shows a complex trend.