Check out today's market views from the global research department of the Trading Center. Discover new trading methods and opportunities from popular trading products.
EUR/USD GBP/USD Spot Gold EUR/JPY EUR/GBP USD/CHF Germany DAX Index Futures (Eurex) Brent Crude Oil (ICE) UK FTSE 100 Index Futures
Warm reminder: Due to market fluctuations, prices may have crossed key points, rendering strategies ineffective.
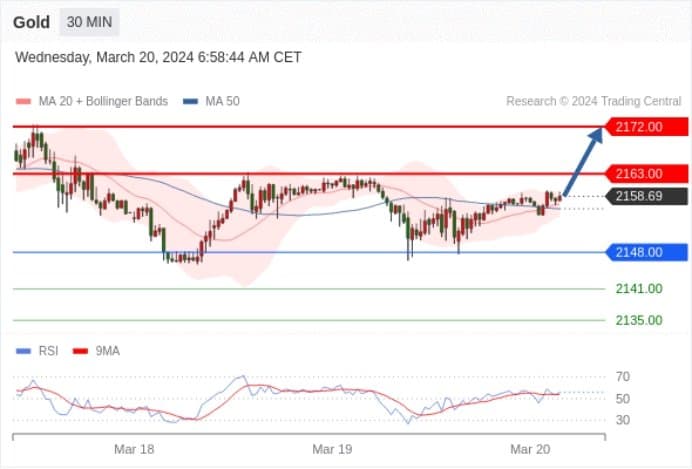
Spot Gold Today: Bullish above 2148.00.
Pivot point:
2148.00
Trading strategy:
Bullish above 2148.00, targeting 2163.00, then 2172.00.
Alternative strategy:
Bearish below 2148.00, targeting 2141.00, then 2135.00.
Technical comment:
RSI indicator is bullish.
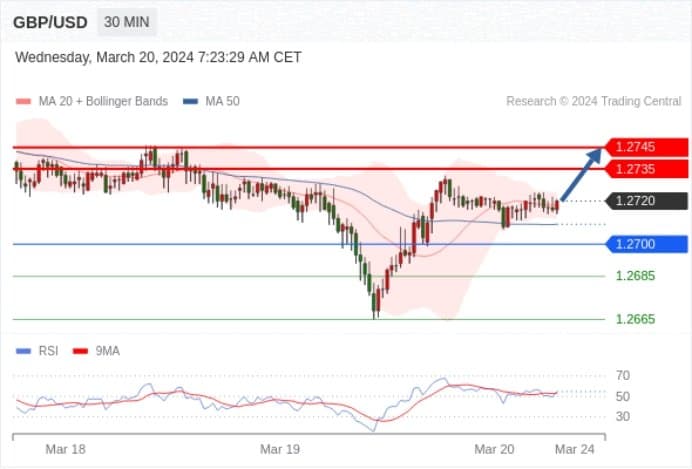
GBP/USD Today: Bullish above 1.2700.
Pivot point:
1.2700
Trading strategy:
Bullish above 1.2700, targeting 1.2735, then 1.2745.
Alternative strategy:
Bearish below 1.2700, targeting 1.2685, then 1.2665.
Technical comment:
RSI indicator trending upwards.
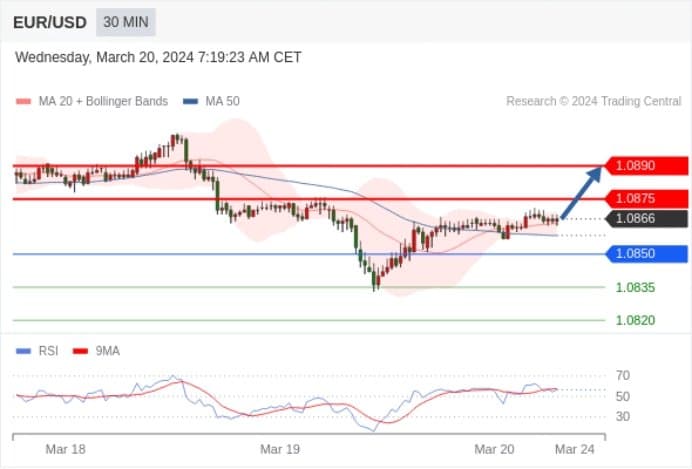
EUR/USD Today: Bullish above 1.0850.
Pivot point:
1.0850
Trading strategy:
Bullish above 1.0850, targeting 1.0875, then 1.0890.
Alternative strategy:
Bearish below 1.0850, targeting 1.0835, then 1.0820.
Technical comment:
RSI indicator trending upwards.
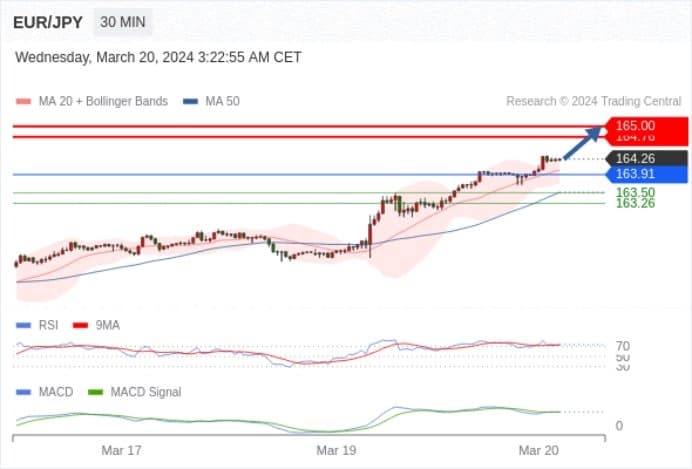
EUR/JPY Today: Bullish, with 163.91 as support.
163.91 as the pivot point.
Trading strategy:
Bullish, with 163.91 as support.
Alternative strategy:
A downward breach of 163.91 will lead to a continued downward trend, targeting 163.50, then 163.26.
Technical comment:
With RSI above 70, there's a sustained upward trend or an overbought condition needing technical adjustment. By comparing changes in the RSI with price trends, one can observe potential technical divergences. The MACD indicator above its signal line is bullish. Additionally, the price is above its 20-day and 50-day moving averages (located at 164.01 and 163.51 respectively).
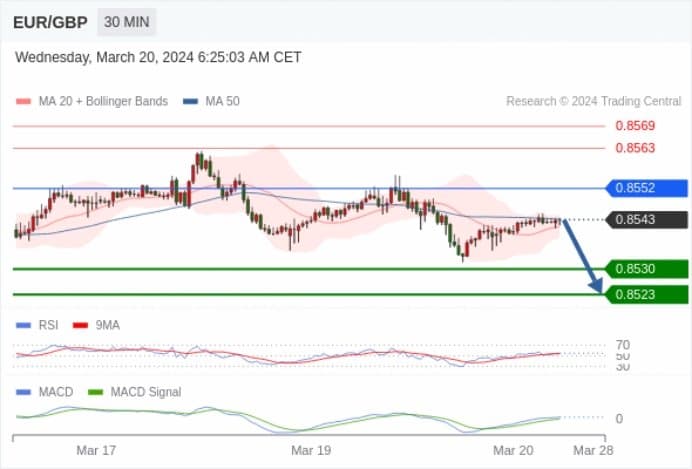
EUR/GBP Today: Rebounding to around 0.8552 before any further decline.
0.8552 as the pivot point.
Trading strategy:
Rebounding to around 0.8552 before any further decline.
Alternative strategy:
If breaching 0.8552, the target for EUR/GBP is 0.8563 and then 0.8569.
Technical comment:
RSI above the neutral zone of 50. MACD indicator above its signal line, bullish. Additionally, the price is below its 50-day moving average (0.8544) but above its 20-day moving average (0.8542).
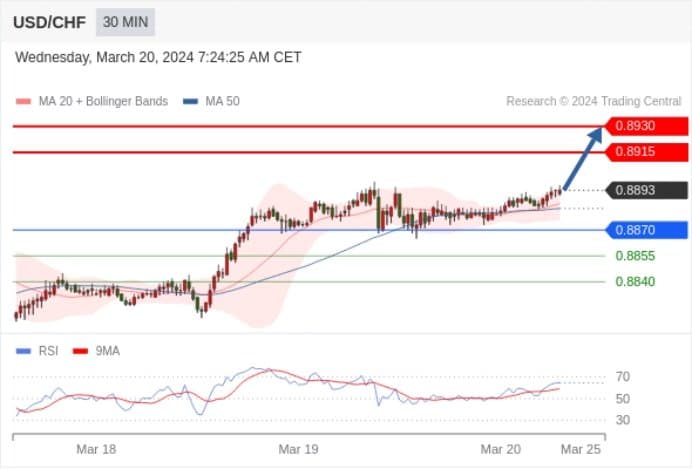
USD/CHF Today: Upward trend.
Pivot point:
0.8870
Trading strategy:
Bullish above 0.8870, targeting 0.8915, then 0.8930.
Alternative strategy:
Bearish below 0.8870, targeting 0.8855, then 0.8840.
Technical comment:
RSI indicator trending upwards.
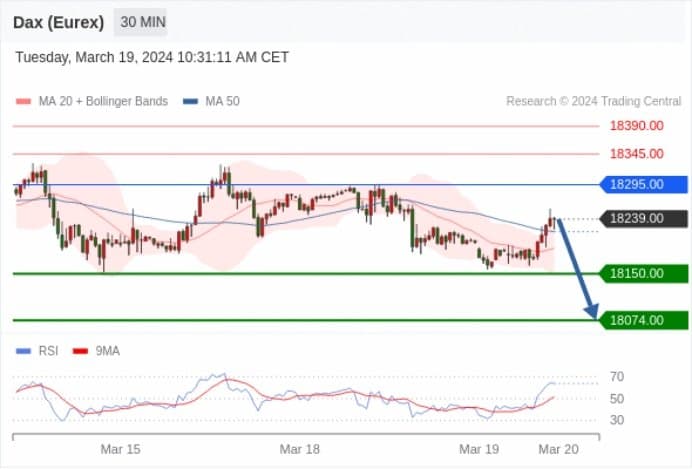
Germany DAX Index Futures (Eurex) (M4) Today: No clear trend.
Pivot point:
18295.00
Trading strategy:
Bearish below 18295.00, targeting 18150.00, then 18074.00.
Alternative strategy:
Bullish above 18295.00, targeting 18345.00, then 18390.00.
Technical comment:
As long as the resistance at 18295.00 exists, there's a bearish trend in price fluctuations.
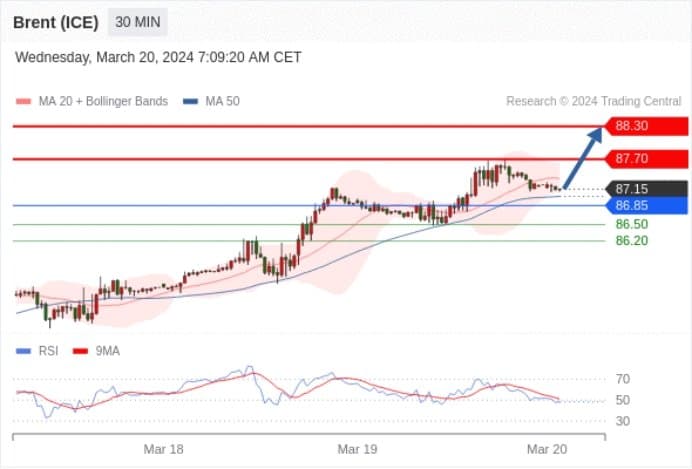
Brent Crude Oil (ICE) (K4) Today: Bullish above 86.85.
Pivot point:
86.85
Trading strategy:
Bullish above 86.85, targeting 87.70, then 88.30.
Alternative strategy:
Bearish below 86.85, targeting 86.50, then 86.20.
Technical comment:
RSI indicator has a complex up-trending pattern.
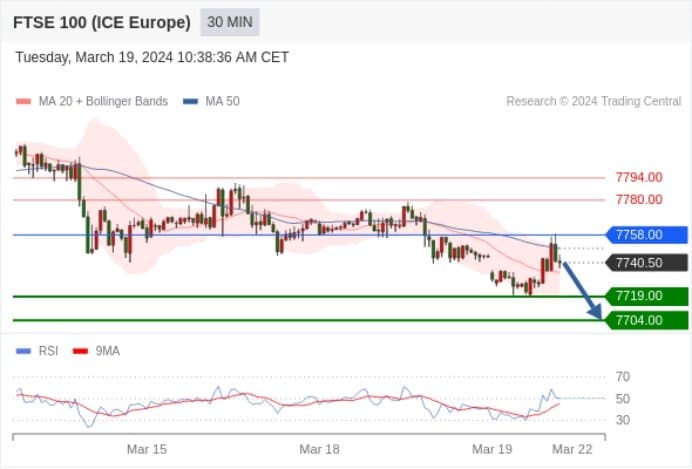
UK FTSE 100 Index Futures Today: Short-term key resistance at 7758.00.
Pivot point:
7758.00
Trading strategy:
Bearish below 7758.00, targeting 7719.00, then 7704.00.
Alternative strategy:
Bullish above 7758.00, targeting 7780.00, then 7794.00.
Technical comment:
As long as the resistance at 7758.00 exists, there's a bearish trend in price fluctuations.