On Tuesday, the price of gold surpassed the $2,200 mark for the second time in history, but fell to $2,182 in the early U.S. stock market. Nowadays, the trading direction of cryptocurrencies follows that of gold, but silver, platinum, and copper have failed to achieve similar gains, raising some concerns.
Alex Kuptsikevich, a senior analyst at FxPro, noted: "The price of gold broke through $2,195, testing the rebound high from the end of February to March 8th. Going above this level would be the first step towards a new round of increases, making a rise to $2,300 possible."
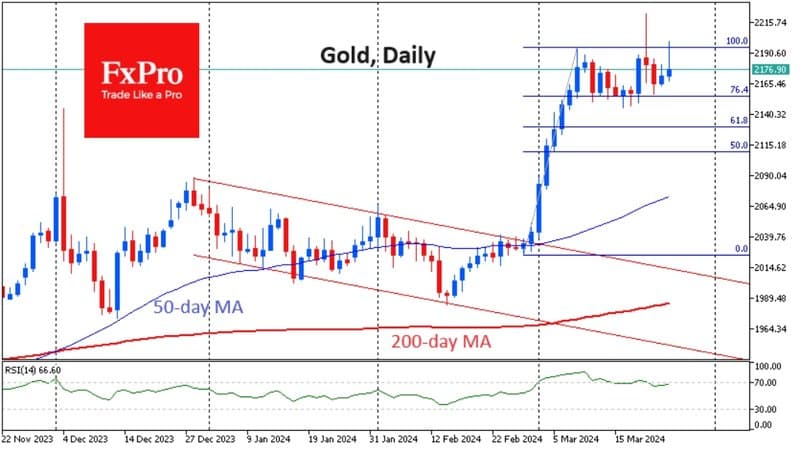
Strictly speaking, there is a higher price on the chart, but this is the result of a slide under low liquidity trading, hence it is not considered a comprehensive breakthrough.
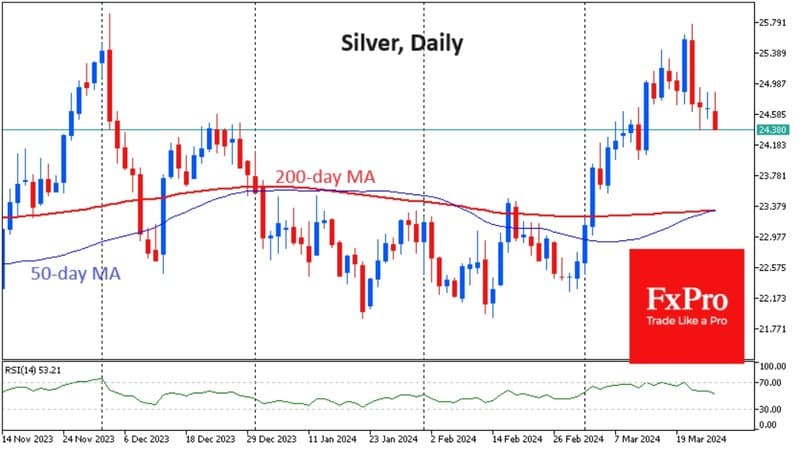
The price of silver has fallen for the fourth consecutive trading day, dropping to $24.4. Platinum has neared $900, close to its local low point, after a 5% drop from its March 15 peak. Copper prices have been trending downward since earlier last week.
Gold is the most liquid metal in the exchange, but its distinction from other metals laid the groundwork for Tuesday's false breakout.
Although the rally in gold prices is impressive, the continuous consolidation of gold miners over the past three weeks has proven this point.
Technically speaking, gold needs to consolidate above $2,200 to start a new bullish momentum. If the price falls further, we should closely monitor the dynamics around $2,150: the failure of this support level could trigger a deeper pullback, with the first target at $2,130.