View the market perspectives today from the global research department of the Trading Center. Explore new trading methods and opportunities from popular trading products.
EUR/USD GBP/USD Spot gold EUR/JPY EUR/GBP USD/CHF Germany DAX Futures (Eurex) Brent crude (ICE) UK FTSE 100 Index Futures
Please note: Due to market volatility, prices may have crossed key positions, rendering strategies ineffective.
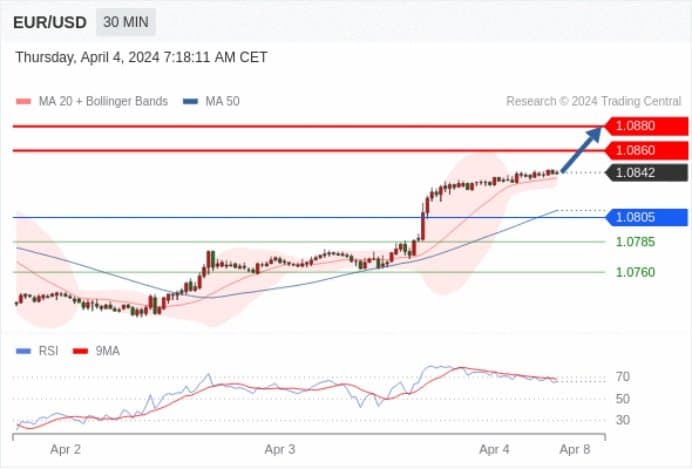
EUR/USD Today: Further rise.
Pivot point:
1.0805
Trading strategy:
Above 1.0805, bullish, target prices at 1.0860 and then 1.0880.
Alternative strategy:
Below 1.0805, bearish, target prices at 1.0785 and then 1.0760.
Technical commentary:
RSI indicator shows an ongoing upward trend.
![432941f2-d2c3-49bc-9176-2d8bc7161627](https://production-app-asset.traderknows.com/images/3f4e6081503a46da92b19781d33cc7bb.width-800.jpg?Expires=1724652175&Signature=0FtyGoAoNiRKuDMbmxGZ0njXm8PV55DIOl1ySi0m7t1PvgyqMRQ2RXYSDEfdh7H7VlIERikzZgY7rwuqKKEquryowGtvdR8Wj~zfkPLehy2Wtj7c1kT-jVvRKesJ7IvR8Jl2r6mk3E-t2rz71STAPrN4CJX1adezn7v0A2899oOXarS9q3h0innj-WEx0xByJn0ApjKigOBwrd3O60X7ehyg~6svYEs~TmKGDhFClhzB3hFs7462nvcxJpVtaMKsUS2suweYsOvi9fccPORKyGm0L2i3cNiNqwkc6Rmswop0CnzZjf5oLwOFVktbn5cc6Vj8m8XIQicHvnqEPlnJxw__&Key-Pair-Id=K3LHBTUA5A7KEY)
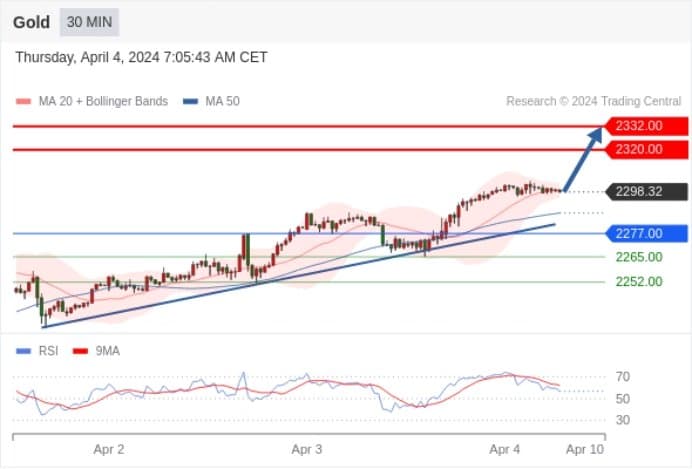
Spot gold Today: Target at 2332.00.
Pivot point:
2277.00
Trading strategy:
Above 2277.00, bullish, target prices at 2320.00 and then 2332.00.
Alternative strategy:
Below 2277.00, bearish, target prices at 2265.00 and then 2252.00.
Technical commentary:
RSI indicator has a complicated running trend, leaning towards an uptrend.
![img_v3_029n_e13071b8-15b7-4af1-abaa-06452972856g](https://production-app-asset.traderknows.com/images/40076e540b93466898e42836cd696519.width-800.jpg?Expires=1724652175&Signature=t3V7P~3BFa8yQiB~WyKHi0VKuqB2F8DU8AkaQfAqARWolwjVQrr-8Wq~PuE4dqM5s08Wt0k3H8U7vmSxCtWfGzrf0Gd9cNqHy35xys3F83F1321v~yO-m15cbhP4DeGBFGXS~rK1rjDCInC1DFqEu6nMRC1oZn9vjpVOO4UPHQyoepiVFL35LInkPQO7BBrNezYfR1n1G2t-9nec9oPSugjEzJXd23BRAnu3HutqP8u9~KuJnHPiZ5gzD36V8N~yKwDzyFU~V-iEJTVA4u~CaSz5fBHuR8TRVHcrvQ4wlDqltd8W9AyhrjqBBj7~PPd~SiPxE5jnyV75FDl0oifZsw__&Key-Pair-Id=K3LHBTUA5A7KEY)
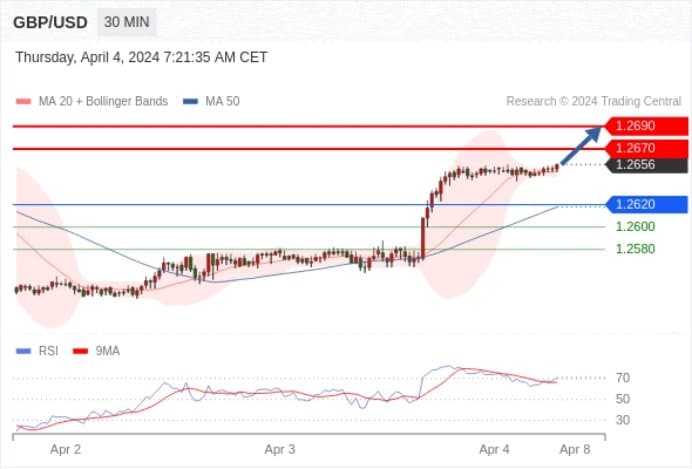
GBP/USD Today: Upward trend.
Pivot point:
1.2620
Trading strategy:
Above 1.2620, bullish, target prices at 1.2670 and then 1.2690.
Alternative strategy:
Below 1.2620, bearish, target prices at 1.2600 and then 1.2580.
Technical commentary:
RSI indicator trending upwards.
![afcf593d-aed3-4f0e-bb66-e4b660b69322](https://production-app-asset.traderknows.com/images/408f250a01b84f0d95d7026c77d4c2f6.width-800.jpg?Expires=1724652175&Signature=dzc0WVRPh4t7D2wVrSyvMcgdVYDkZ3buecmX3TVOUpsLasV30qBeXTKN4Lbu4m0yfdPE0aluJtJqiktKPkxhjeRPa1R~~Hca1UCeqsxehvsE-jiBJtvGtFWvkOkVaqj7kOjjZaxw9z1D2FnFz3OXgt0RJ2vl4fZ44x3a3HjHAQC9Lz0WltC5ZCK~Cv298pTjGYxQLcytwPfHmfdjzjDa6poGr8VKNHn7VA69Pmp4j8GUkAD7Yt~145aIiU~v5z5c9idHtO0B73nUcgbJ7Lfr4PTZTlLZGmIy-uS3qMlFRNuXIthwrD9ofCe5pwj~2Hn8ZhoENz2~CnjwE3kd9AKfQA__&Key-Pair-Id=K3LHBTUA5A7KEY)
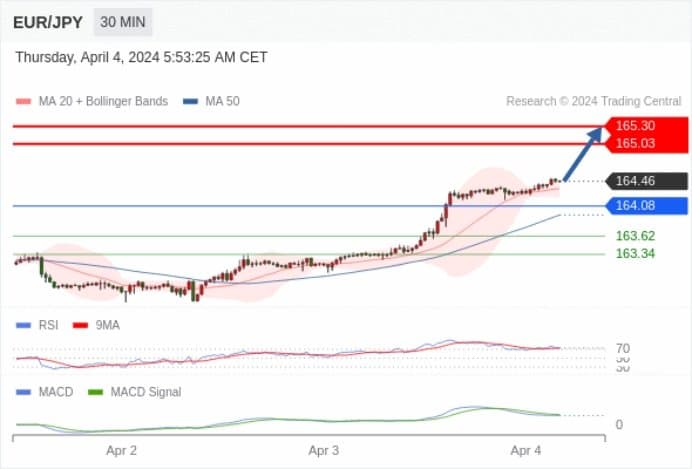
EUR/JPY Today: Bullish, with 164.08 as the support, targeting 165.30.
Pivot point:
164.08
Trading strategy:
Bullish, with 164.08 as the support, targeting 165.30.
Alternative strategy:
If it falls below 164.08, EUR/JPY targets are set at 163.62 and 163.34.
Technical commentary:
The RSI indicator above 70 may indicate a sustained upward trend or an overbought condition needing technical adjustment. By comparing the trends between RSI and price positions, one can observe if there's a technical divergence. The MACD indicator is above its signal line indicating bullish sentiment. Moreover, prices are above their 20-day and 50-day moving averages (currently at 164.35 and 163.94).
![1cfe2acf-65df-410d-89e8-efa3c8d96c71](https://production-app-asset.traderknows.com/images/9cb818327d294e2a95b8f4fb96c0ccf6.width-800.jpg?Expires=1724652175&Signature=LZDjk0sRUrtjd8d1FG-D3SyaqQ2WLASOhjHXRoVqydDbhKFwMVgSlLDo1nkD-gIEwK4NRwOnA23i-E3aoEpDl-ObW-rTjg9fiu22AHrArfX1EWS0pmGCb93j1uZSizZtu5btA5yBKk0JZykurthsNv9fNBFYqanfO3QwDvT3GP8Sp4yGnkQrIaOASO6auf4Vn14GBQOCNZlOylVTemxRqhc2HAWG9Idl6DIv0r5wT96ciHTVrp1U~etlfVT1DTB94TPGSiqstLa1r7vKvQx9wj~VG2ZxSjrNakJKVhrT8jAmR8YNokHEdSkJDEbKnOVITskWgAT-mNsW2X4mpL3WKQ__&Key-Pair-Id=K3LHBTUA5A7KEY)
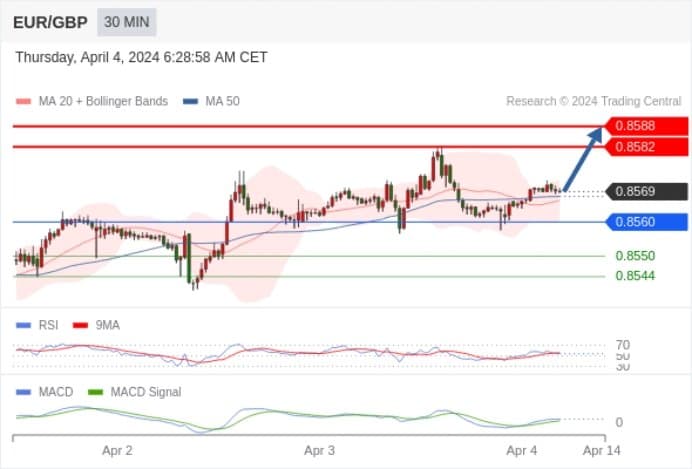
EUR/GBP Today: Bullish, with 0.8560 as the support.
Pivot point:
0.8560
Trading strategy:
Bullish, with 0.8560 as the support.
Alternative strategy:
A downward break of 0.8560 will indicate a continuing downtrend, with target prices at 0.8550 and then 0.8544.
Technical commentary:
The RSI indicator is above the neutral 50 area. The MACD indicator is above its signal line indicating bullish sentiment. Additionally, prices are higher than their 20-day and 50-day moving averages (at 0.8566 and 0.8567 respectively).
![9652f055-c7c5-4258-bf33-6a8120322733](https://production-app-asset.traderknows.com/images/3a55dff25a0a428a87affad954fcf0a0.width-800.jpg?Expires=1724652175&Signature=ViMGvHzrqubiUbUCKKrnLcgxjK3hV~LxIZ6H7DjVq2-lC3VzJPmMJW~puDX0~kuGq-w7~9R2~Ei6TokVngddWJFwwgYYbLf~ohA0rfrIWV3Y7rPw5T1hpOoBjxeklCwSAocNYkAVSbP35BnyX7FNlbEoYV32WeRrqYcuelAHf~TZuvEXufhbqM3pox33o~xdjhuzJyTvWvcJyXzdnA4MhvjMsTJ5yLzG2KR0pk2KgHhiha7bwuY8p9T61LEctrjoWjVG3k1SaIFUcXa8JQTziONz8hBJ2WRqZ~CKK44sg0~bwhj9LpA01JqLKbXslqE3VCazXW--VCMU2nDjOoN3xQ__&Key-Pair-Id=K3LHBTUA5A7KEY)
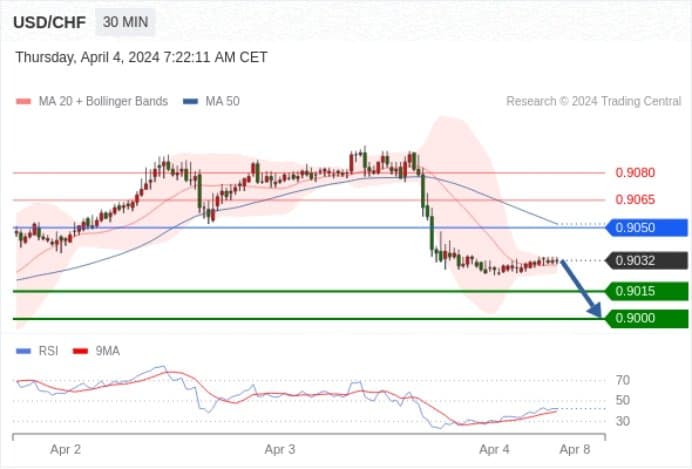
USD/CHF Today: Under pressure.
Pivot point:
0.9050
Trading strategy:
Below 0.9050, bearish, target prices at 0.9015 and then 0.9000.
Alternative strategy:
Above 0.9050, bullish, target prices at 0.9065 and then 0.9080.
Technical commentary:
As long as the resistance at 0.9050 is not breached, there's a high risk of falling below 0.9015.
![e29716d9-a5b4-4906-b907-27f1a12d7afc](https://production-app-asset.traderknows.com/images/711b384353f749d5a3e5a56203798cf5.width-800.jpg?Expires=1724652175&Signature=Ifj0nrMBoJwK7j2cl51TnOZ4ZRGfzl0y6vrBHepSkkbvWB61h-EqJD5jSOenRU1G0~uDmnU9PX9W~aSQPPQSHaKarcoXXaB0fRzaYfZSApH811bD9PXHVaqCRnIUG1xcqYtOJNcw9IGyf4lmkUNNnEiVeQgygutrYlESFTfivRPhIH0VKhX2tGK3-NY4vCItRjq0bD~X1Mz3nMfsffFc5VeqjAiIUwMsxTnUWtHZjALY~~shqli4GNUNtssWxPO-ICAZwbieDsX~eb-LkG35sBuG2tNIvxLmUPR2C~V1wI8vC7UO3ExWkG~v0ScP4YEp69UZA0WoCVdNhIAdgZ0kjQ__&Key-Pair-Id=K3LHBTUA5A7KEY)
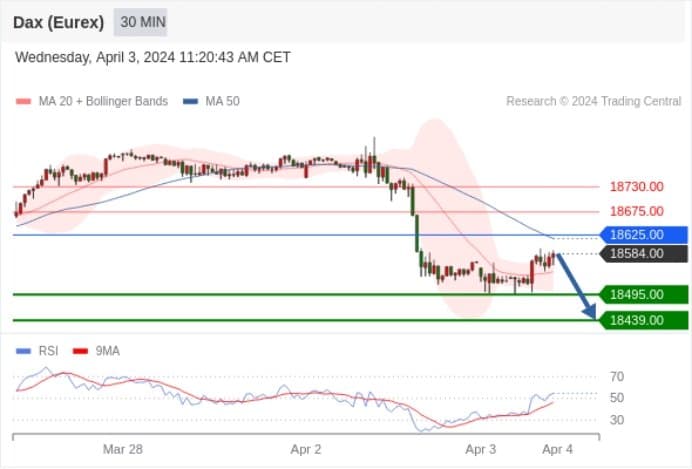
Germany DAX Futures (Eurex) (M4) Today: No clear trend.
Pivot point:
18625.00
Trading strategy:
Below 18625.00, bearish, target prices at 18460.00 and then 18400.00.
Alternative strategy:
Above 18625.00, bullish, target prices at 18675.00 and then 18730.00.
Technical commentary:
The RSI indicator has a complicated running trend.
![c188469d-10d7-4037-9b55-3096a3c01365](https://production-app-asset.traderknows.com/images/a7ce034c786041eb8c5e1050da78a538.width-800.jpg?Expires=1724652175&Signature=iDCIu4QbIotHYDovf3ROftg7nswHDrcuwdbL1BZU5Vp7iCLL5SiSsNOXX9Pcc8Uhd6YILQCVP35WahbG91bVj9~YrW6DVByeNxVBcU6eRhw4P4joX964FJoGJbQveZUOhq0IKiSoPyqwCk5h4L~4Rrq7pQ1FE5AWtt814yPOgNn7DyNZuxqKtwYVm8s3qews8acfId0C8bqQgiLoZGRg0aCD3sLZ9zmUjC02i~bDeOhA-SnOVDYW~2FsfkJ-6~CylpPQdkMI~GPwxDboUnI5~7C26lB~IG3DMd1pgv5RpWqRrvGvmzO-hAxtedw-ZIljS~dMRy49YERpXjConH3oKQ__&Key-Pair-Id=K3LHBTUA5A7KEY)
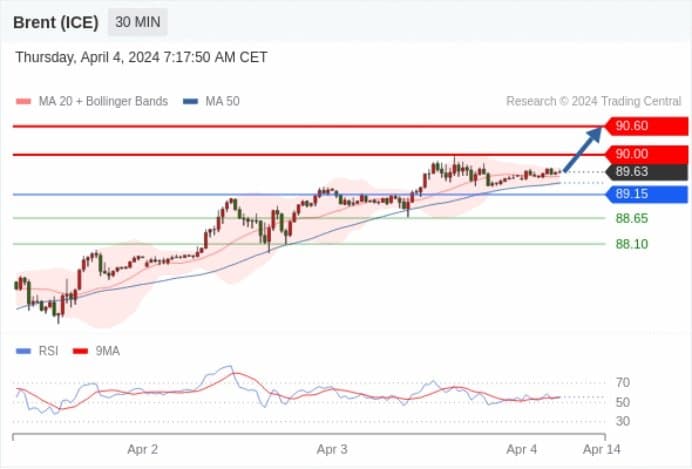
Brent crude (ICE) (M4) Today: Bullish above 89.15.
Pivot point:
89.15
Trading strategy:
Above 89.15, bullish, target prices at 90.00 and then 90.60.
Alternative strategy:
Below 89.15, bearish, target prices at 88.65 and then 88.10.
Technical commentary:
From a technical perspective, the RSI indicator is above the neutral 50% area.
![612a175e-d864-4264-837f-719e50c8e6b4](https://production-app-asset.traderknows.com/images/eaf69abdef384cb796f54969fa19dbdf.width-800.jpg?Expires=1724652175&Signature=P8UnNPjiP5gcToIFQGv3yhFsYkNsj4F~XI2RTEP6CLbHyitgJeurUSt~sWveVdcBZNCHtWPBrLQGBZTIMDETqORINfW0rcfrU4mxoCZCfEvqeyvPrieyhiEcvp98Gl9IyqHdMvUPpAJcr-3GyJdwo6cgn9xY9OOziLLWTmgDbr46ekuEMTjC5Vz-oAumBE2kgsEV993u0LMYAg-0XIcuzALslZPZgDSdoLHOEFXPtxZq926JLEJKuO2oQa5Jjc99n6CwpPvHdUHfiML2c9E3QIsTn-I2isFKUiPbsE45-kDUkS0KUbjEk4CwPqg7APNfuPaTfR8M4MWmvbqI3fPGvQ__&Key-Pair-Id=K3LHBTUA5A7KEY)
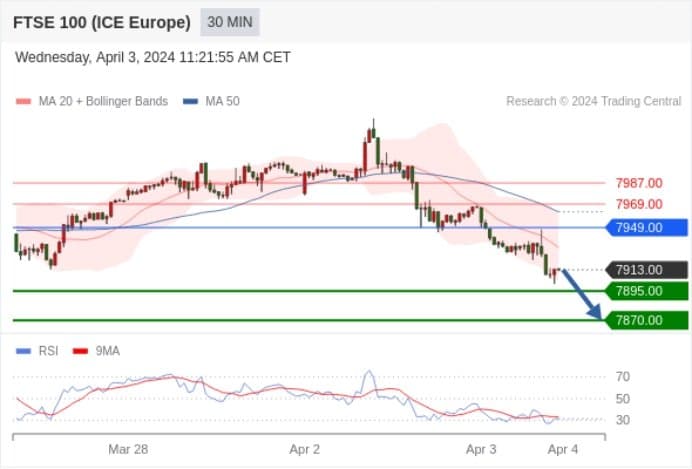
UK FTSE 100 Index Futures Today: Short-term key resistance at 7949.00.
Pivot point:
7949.00
Trading strategy:
Below 7949.00, bearish, target prices at 7895.00 and then 7870.00.
Alternative strategy:
Above 7949.00, bullish, target prices at 7969.00 and then 7987.00.
Technical commentary:
The RSI indicator is bearish with further downside potential.
![a7b5fcb5-c757-4a78-9b0a-dd45e579d049](https://production-app-asset.traderknows.com/images/92478285b57a4109ab3397d3db5ac40c.width-800.jpg?Expires=1724652175&Signature=l38J3ivbCjARct077CouEquAgFtQAag~UNqiu-Ju4TJ4EIPje43Pl0m6AIeCFqSa-pFZZhBUS77zFKISsKwaAiE9sQTcrzhmZIWqygBJ~kTEBSgzggn8UzRUw0hFWuSNISBFprNdv3V~UpRkvdWbt1KvdpicRabQwcIBw87LLfLGal77ptN8vr8K567xjxB1wssq74mI66LwZ5onhp4i0Apn-vmZAy4~mzRCkwtA95Rp4HKQLhUD-CLWKKuOvRrUi5J03jHRu4pPqGkV0geaj6QEXP1BdbBn1xQyFPNoYMc-zLJHa-MWkLnRvwcPOGMqqVjdQxnHwTlvxTCNziDgGA__&Key-Pair-Id=K3LHBTUA5A7KEY)