Explore new trading methods and opportunities from popular trading products as you review the market perspective from the Global Research Department at the Trade Center today.
EUR/USD GBP/USD Spot Gold EUR/JPY EUR/GBP USD/CHF Germany DAX Index Futures (Eurex) Brent Crude (ICE) UK FTSE 100 Index Futures
Please note: Due to market fluctuations, prices may have moved past key points, rendering strategies ineffective.
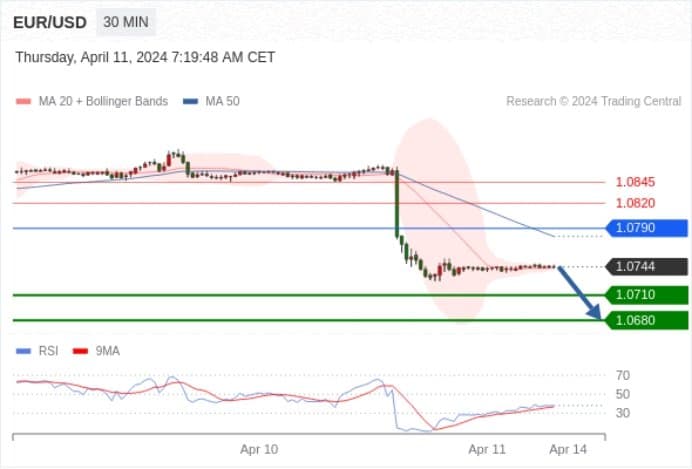
EUR/USD Today: Under pressure.
Pivot point:
1.0790
Trading strategy:
Below 1.0790, bearish with target prices at 1.0710, followed by 1.0680.
Alternative strategy:
Above 1.0790, bullish with target prices at 1.0820, followed by 1.0845.
Technical commentary:
As long as the resistance level of 1.0790 is not breached, the risk of falling below 1.0710 is heightened.
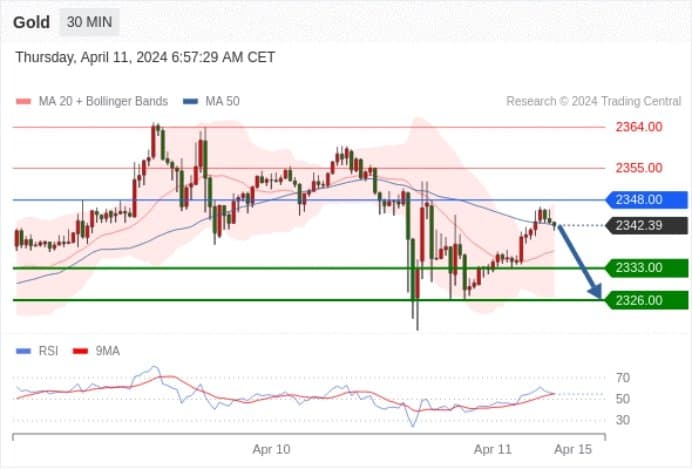
Spot Gold Today: Short-term key resistance level at 2348.00.
Pivot point:
2348.00
Trading strategy:
Below 2348.00, bearish with target prices at 2333.00, followed by 2326.00.
Alternative strategy:
Above 2348.00, bullish with target prices at 2355.00, followed by 2364.00.
Technical commentary:
The upward space may be limited by the resistance level at 2348.00.
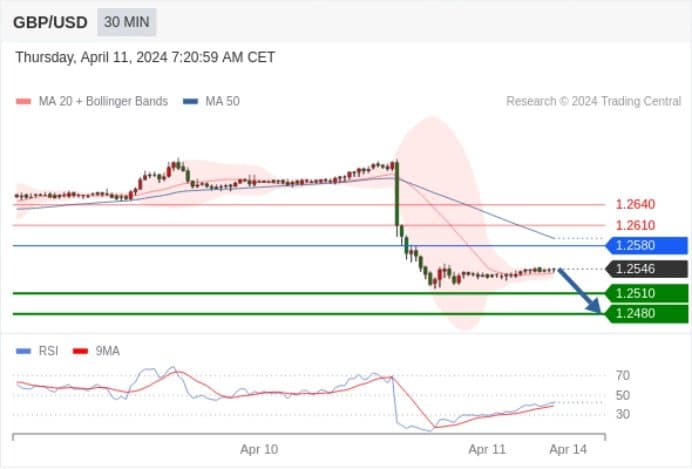
GBP/USD Today: Short-term key resistance level at 1.2580.
Pivot point:
1.2580
Trading strategy:
Below 1.2580, bearish with target prices at 1.2510, followed by 1.2480.
Alternative strategy:
Above 1.2580, bullish with target prices at 1.2610, followed by 1.2640.
Technical commentary:
As long as the resistance level of 1.2580 is not breached, the risk of falling below 1.2510 is heightened.
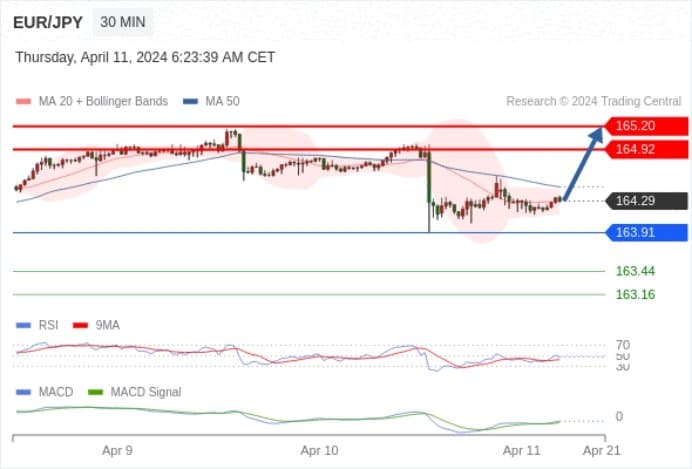
EUR/JPY Today: Potential for rise, with a target price at 165.20.
Pivot point set at:
163.91
Trading strategy:
Potential for rise, with a target price at 165.20.
Alternative strategy:
If it falls below 163.91, EUR/JPY target direction is set at 163.44 and 163.16.
Technical commentary:
The RSI technical indicator is below the neutral 50. The MACD technical indicator is above its signal line, indicating bearish sentiment. Additionally, the price is below its 50-day moving average (164.47) but above the 20-day moving average (164.29).
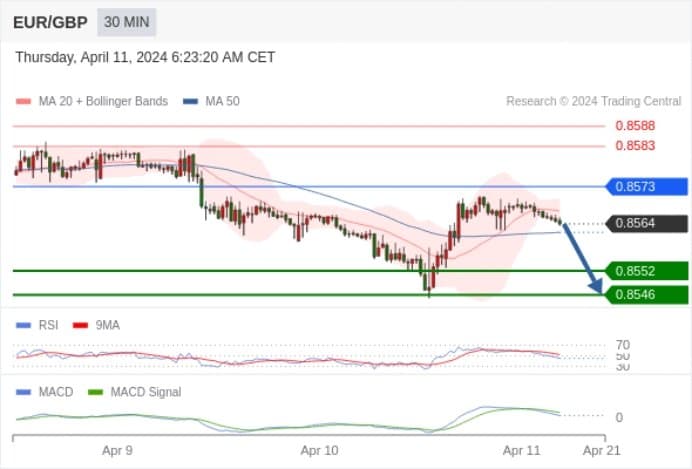
EUR/GBP Today: Gradual decline, with 0.8546 as the target when 0.8573 obstructs upward movement.
Pivot point at:
0.8573
Trading strategy:
Gradual decline, with 0.8546 as the target when 0.8573 obstructs upward movement.
Alternative strategy:
A breakout above 0.8573 will lead to a continuing upward trend, with target prices set at 0.8583 and 0.8588.
Technical commentary:
The RSI technical indicator is below 50. The MACD technical indicator is bullish and below its signal line. Additionally, the price is below its 20-day moving average (0.8567) but above its 50-day moving average (0.8562). Lastly, the price has fallen below the lower band of its Bollinger Bands (located at 0.8564).
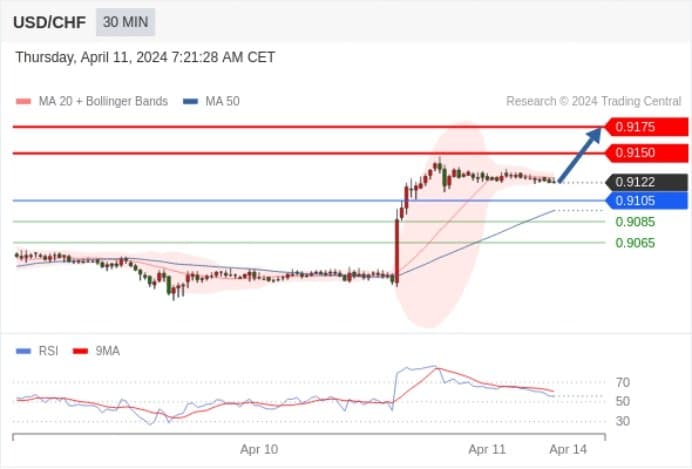
USD/CHF Today: Upward trend.
Pivot point:
0.9105
Trading strategy:
Above 0.9105, bullish with target prices at 0.9150, followed by 0.9175.
Alternative strategy:
Below 0.9105, bearish with target prices set at 0.9085, followed by 0.9065.
Technical commentary:
Technically, the RSI technical indicator is above the 50% neutral area.
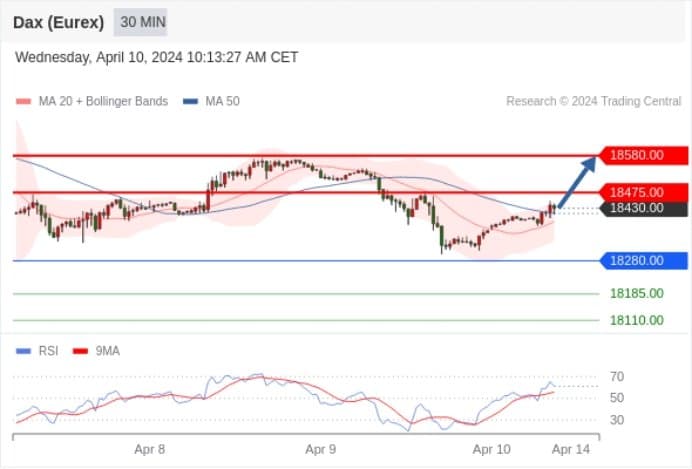
Germany DAX Index Futures (Eurex) (M4) Today: Limited upside.
Pivot point:
18280.00
Trading strategy:
Above 18280.00, bullish with target prices at 18475.00, followed by 18580.00.
Alternative strategy:
Below 18280.00, bearish with target prices set at 18185.00, followed by 18110.00.
Technical commentary:
A support base around 18280.00 could bring short-term stability to the trend.
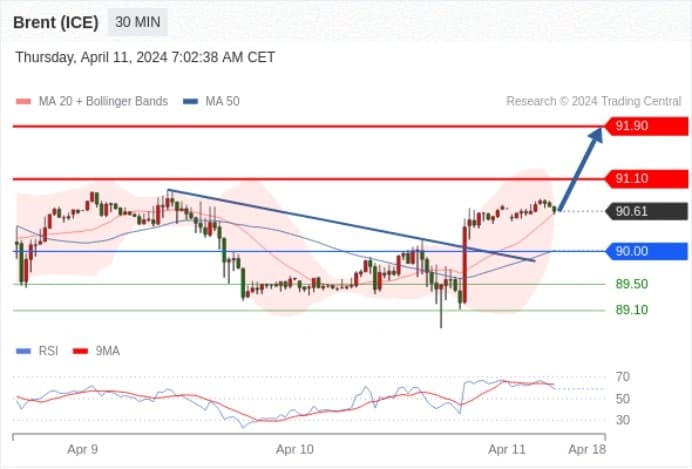
Brent Crude (ICE) (M4) Today: Upward trend.
Pivot point:
90.00
Trading strategy:
Above 90.00, bullish with target prices at 91.10, followed by 91.90.
Alternative strategy:
Below 90.00, bearish with target prices set at 89.50, followed by 89.10.
Technical commentary:
The RSI technical indicator shows a continuing upward trend.
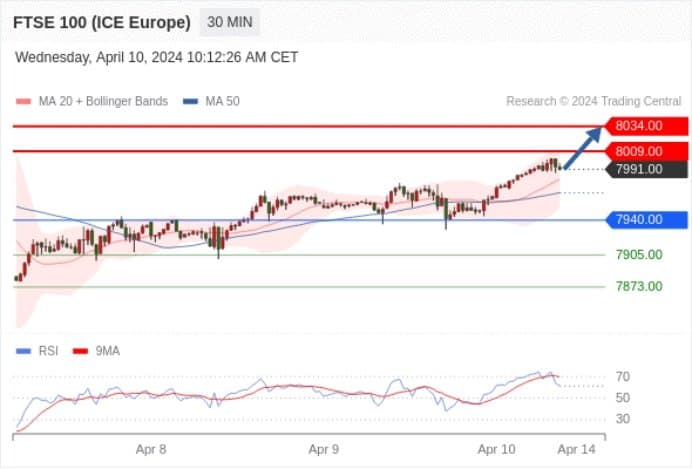
UK FTSE 100 Index Futures Today: Bullish.
Pivot point:
7940.00
Trading strategy:
Above 7940.00, bullish with target prices at 8009.00, followed by 8034.00.
Alternative strategy:
Below 7940.00, bearish with target prices set at 7905.00, followed by 7873.00.
Technical commentary:
The RSI technical indicator has a complex running trend.