Check out today's market insights from the Global Research Department of the Trading Center. Explore new trading methods and opportunities from popular trading products.
EUR/USD Gold Spot GBP/USD EUR/JPY EUR/GBP USD/CHF Germany DAX Index Futures (Eurex) Brent Crude (ICE) UK FTSE 100 Index Futures
Warm Reminder: Due to market fluctuations, prices may have crossed key points, rendering strategies ineffective.
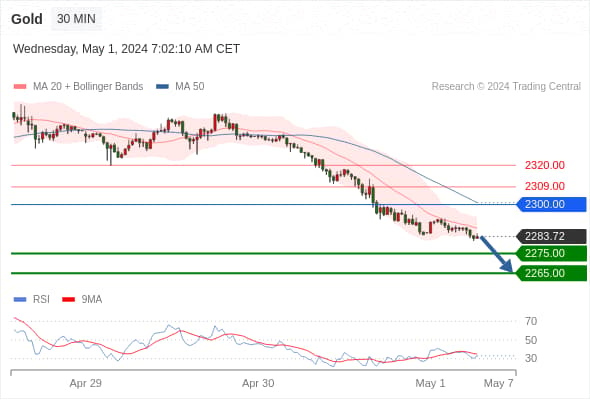
Gold Spot Today: Downtrend.
Pivot Point:
2300.00
Trading Strategy:
Below 2300.00, bearish, target prices at 2275.00, then 2265.00.
Alternative Strategy:
Above 2300.00, bullish, target prices at 2309.00, then 2320.00.
Technical Commentary:
RSI indicator trending downward.
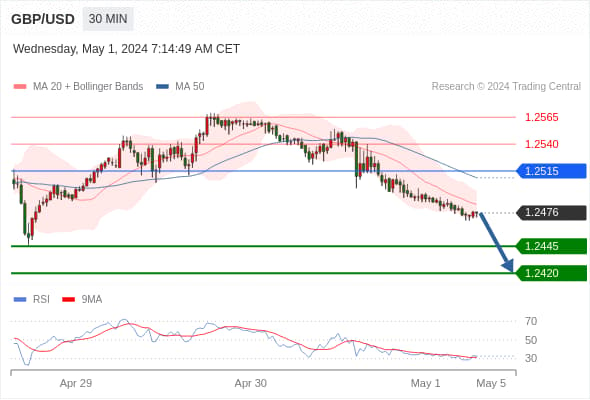
GBP/USD Today: Downtrend.
Pivot Point:
1.2515
Trading Strategy:
Below 1.2515, bearish, target prices at 1.2445, then 1.2420.
Alternative Strategy:
Above 1.2515, bullish, target prices at 1.2540, then 1.2565.
Technical Commentary:
RSI indicator trending downward.
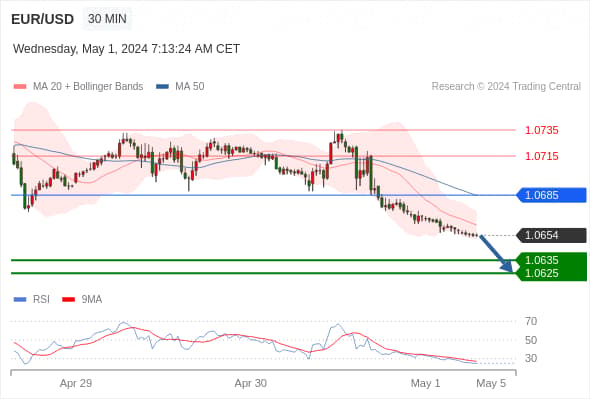
EUR/USD Today: Downtrend.
Pivot Point:
1.0685
Trading Strategy:
Below 1.0685, bearish, target prices at 1.0635, then 1.0625.
Alternative Strategy:
Above 1.0685, bullish, target prices at 1.0715, then 1.0735.
Technical Commentary:
RSI indicator has breached below its 30 level.
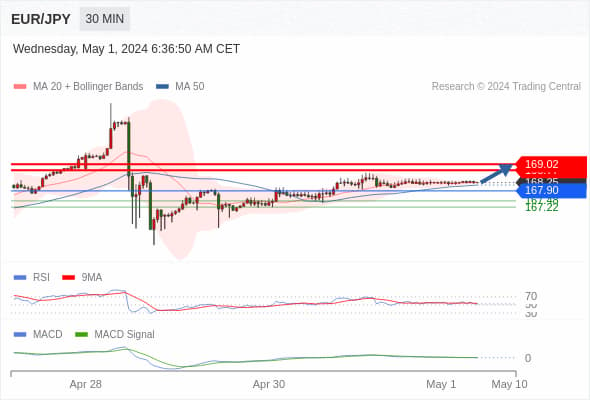
EUR/JPY Today: Bullish, with 167.90 as the support level, target set at 169.02.
167.90 as the Pivot Point.
Trading Strategy:
Bullish, with 167.90 as the support level, target set at 169.02.
Alternative Strategy:
A break below 167.90, will lead to a continuing downward trend, target prices at 167.48 then 167.22.
Technical Commentary:
RSI indicator is above the neutral zone of 50. MACD indicator is below its signal line but bullish. Additionally, price is below its 20-day moving average (168.25) but above its 50-day moving average (168.15).
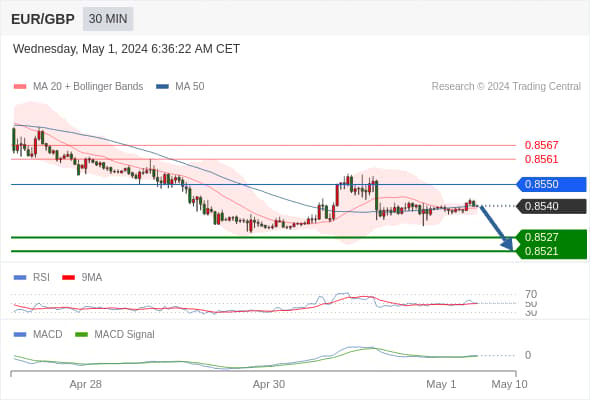
EUR/GBP Today: A rebound to around 0.8550 before further decline.
0.8550 as the Pivot Point.
Trading Strategy:
A rebound to around 0.8550 before further decline.
Alternative Strategy:
A breakout above 0.8550, will lead to a continuing upward trend, target prices at 0.8561 and 0.8567.
Technical Commentary:
RSI indicator is above the neutral zone of 50. MACD indicator is bullish and above its signal line. Additionally, price is below its 50-day moving average (0.8541) but above its 20-day moving average (0.8540).
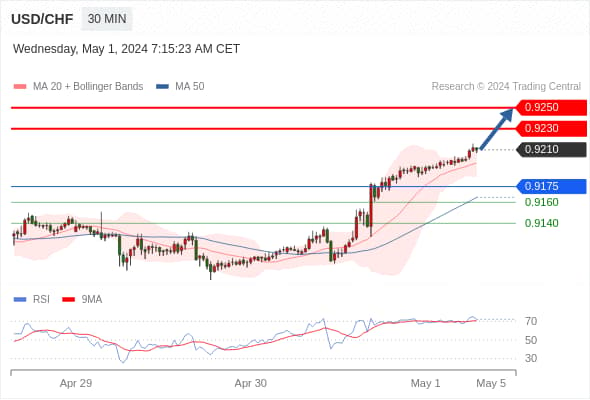
USD/CHF Today: A new round of upward movement.
Pivot Point:
0.9175
Trading Strategy:
Above 0.9175, bullish, target prices at 0.9230, then 0.9250.
Alternative Strategy:
Below 0.9175, bearish, target prices at 0.9160, then 0.9140.
Technical Commentary:
RSI indicator shows a further upward trend.
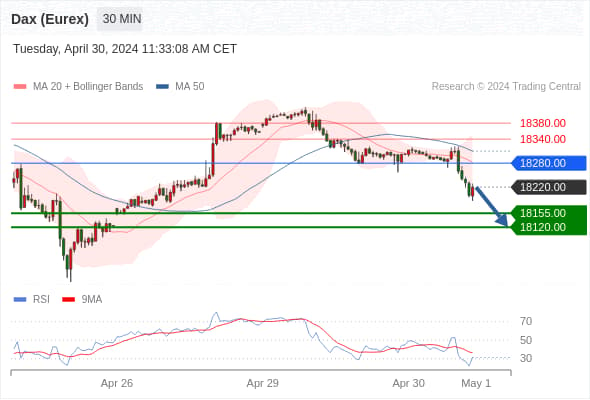
Germany DAX Index Futures (Eurex) (M4) Today: Short-term adjustment.
Pivot Point:
18280.00
Trading Strategy:
Below 18280.00, bearish, target prices at 18155.00, then 18120.00.
Alternative Strategy:
Above 18280.00, bullish, target prices at 18340.00, then 18380.00.
Technical Commentary:
RSI indicator is below the 50% neutral zone.
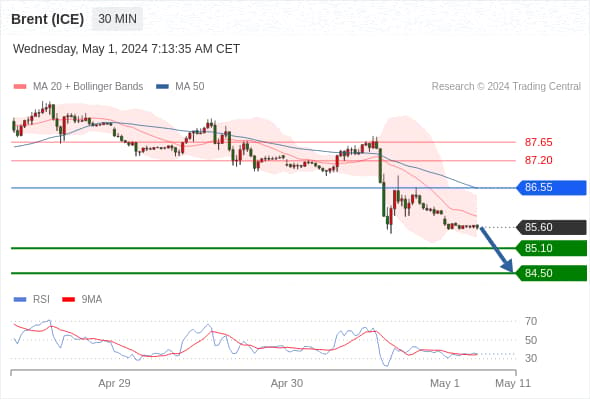
Brent Crude (ICE) (N4) Today: Downtrend.
Pivot Point:
86.55
Trading Strategy:
Below 86.55, bearish, target prices at 85.10, then 84.50.
Alternative Strategy:
Above 86.55, bullish, target prices at 87.20, then 87.65.
Technical Commentary:
RSI indicator shows a new downward trend.
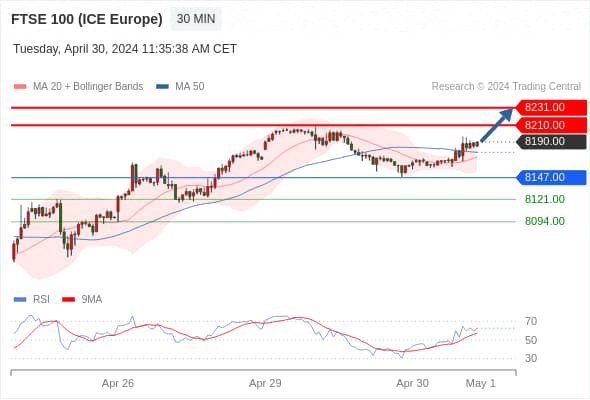
UK FTSE 100 Index Futures Today: Short-term (intraday) support near 8147.00.
Pivot Point:
8147.00
Trading Strategy:
Above 8147.00, bullish, target prices at 8210.00, then 8231.00.
Alternative Strategy:
Below 8147.00, bearish, target prices at 8121.00, then 8094.00.
Technical Commentary:
RSI indicator shows a complex trend with an inclination towards rising.