View the market insights from the Global Research Department of the Trading Center today. Discover new trading methods and opportunities from popular trading products.
EUR/USD Spot Gold GBP/USD EUR/JPY EUR/GBP USD/CHF German DAX Index Futures (Eurex) Brent Crude Oil (ICE) UK FTSE 100 Index Futures
Note: Due to market volatility, prices may have already crossed key levels, rendering the strategy invalid.
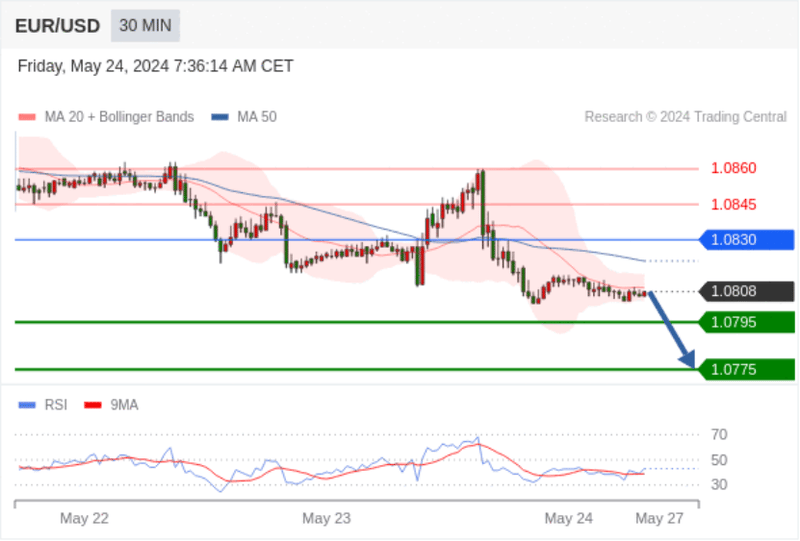
EUR/USD Intraday: Under Pressure.
Pivot point:
1.0830
Trading strategy:
Bearish below 1.0830, target prices are 1.0795, then 1.0775.
Alternative strategy:
Bullish above 1.0830, target prices are 1.0845, then 1.0860.
Technical commentary:
As long as resistance at 1.0830 is not surpassed, the risk of a decline below 1.0795 remains high.
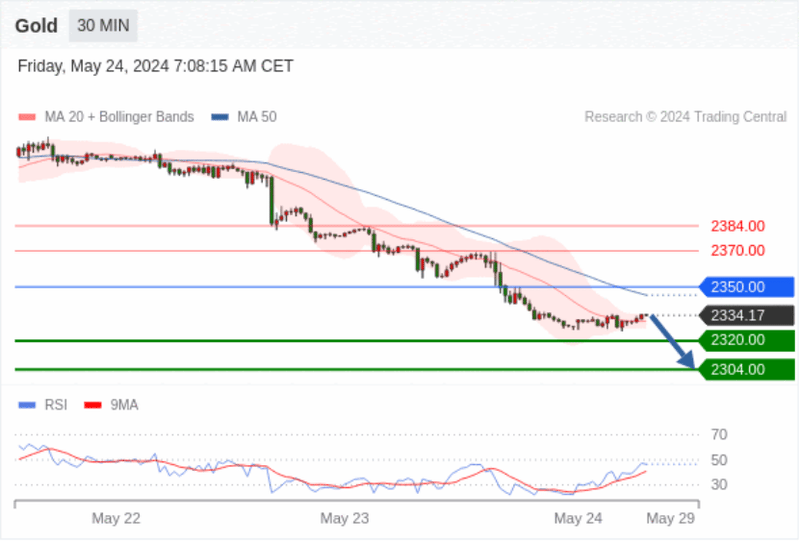
Spot Gold Intraday: Under Pressure.
Pivot point:
2350.00
Trading strategy:
Bearish below 2350.00, target prices are 2320.00, then 2304.00.
Alternative strategy:
Bullish above 2350.00, target prices are 2370.00, then 2384.00.
Technical commentary:
The RSI indicator is trending downward, indicating a complex, bearish outlook.
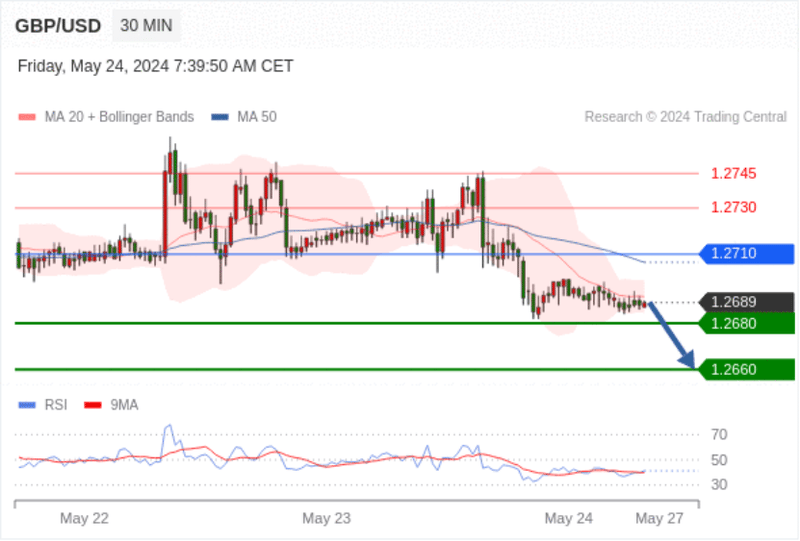
GBP/USD Intraday: Short-term key resistance at 1.2710.
Pivot point:
1.2710
Trading strategy:
Bearish below 1.2710, target prices are 1.2680, then 1.2660.
Alternative strategy:
Bullish above 1.2710, target prices are 1.2730, then 1.2745.
Technical commentary:
As long as resistance at 1.2710 is not surpassed, the risk of a decline below 1.2680 remains high.
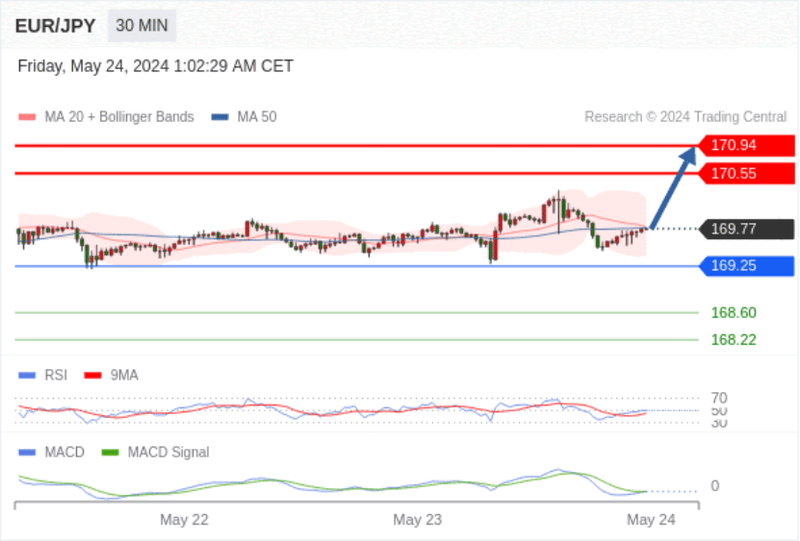
EUR/JPY Intraday: Possible upward movement, target at 170.94.
169.25 as a pivot point.
Trading strategy:
Possible upward movement, target at 170.94.
Alternative strategy:
If it falls below 169.25, EUR/JPY target direction is 168.60 and 168.22.
Technical commentary:
The RSI indicator is below the neutral region of 50. The MACD indicator is above its signal line, signaling bearishness. Also, the price is below its 20-day and 50-day moving averages (at 169.80 and 169.79, respectively).
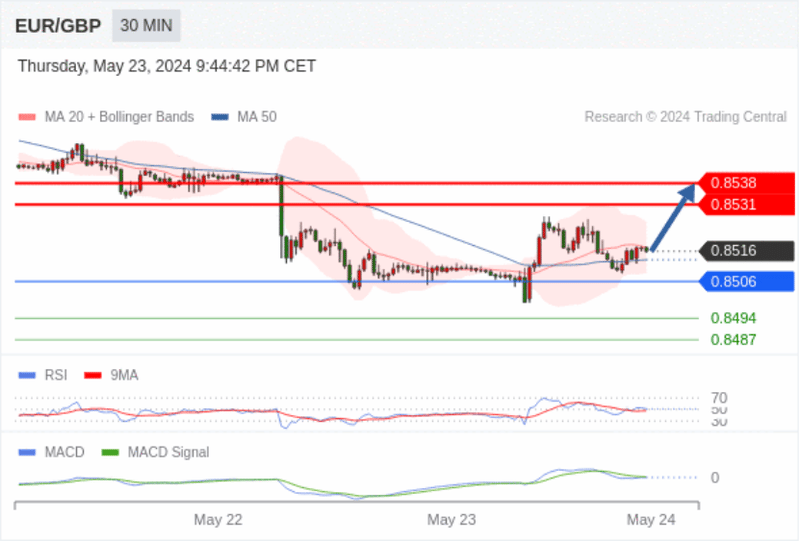
EUR/GBP Intraday: Bullish as long as 0.8506 is support, target at 0.8538.
Pivot point:
0.8506
Trading strategy:
Bullish as long as 0.8506 is support, target at 0.8538.
Alternative strategy:
If it breaks below 0.8506, it will continue the downward trend, with targets at 0.8494 and then 0.8487.
Technical commentary:
The RSI indicator is above 50. The MACD indicator is below its signal line, signaling bullishness. Additionally, the price is below its 20-day moving average (0.8517) but above its 50-day moving average (0.8513).
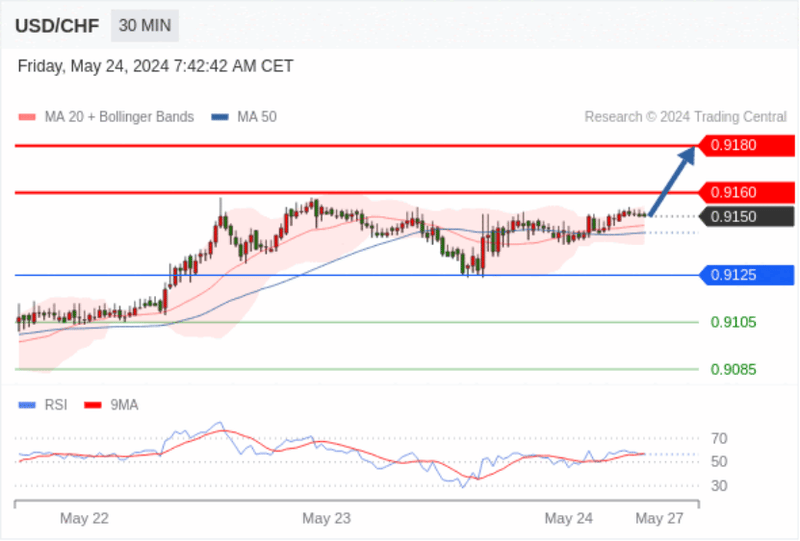
USD/CHF Intraday: Ultra short-term support around 0.9125.
Pivot point:
0.9125
Trading strategy:
Bullish above 0.9125, target prices are 0.9160, then 0.9180.
Alternative strategy:
Bearish below 0.9125, target prices are 0.9105, then 0.9085.
Technical commentary:
The RSI indicator is showing a complex trend, leaning towards upward movement.
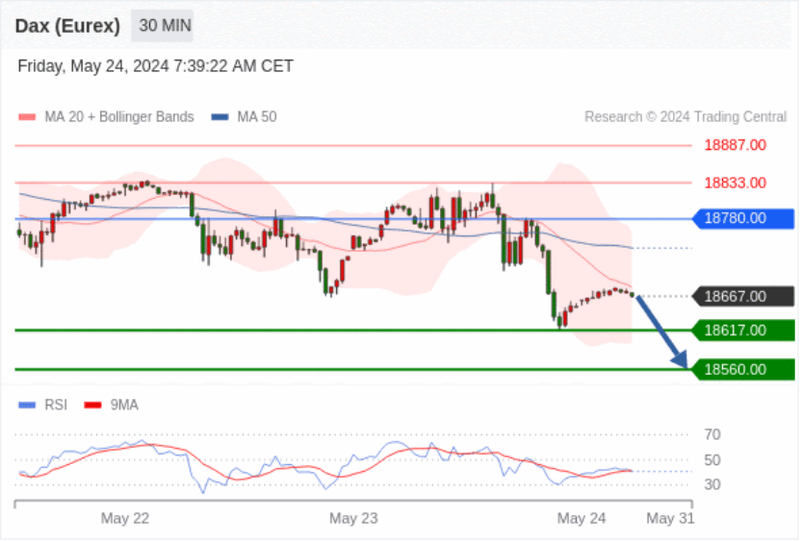
German DAX Index Futures (Eurex) Intraday: Under Pressure.
Pivot point:
18780.00
Trading strategy:
Bearish below 18780.00, target prices are 18617.00, then 18560.00.
Alternative strategy:
Bullish above 18780.00, target prices are 18833.00, then 18887.00.
Technical commentary:
The RSI indicator is below the 50% neutral zone.
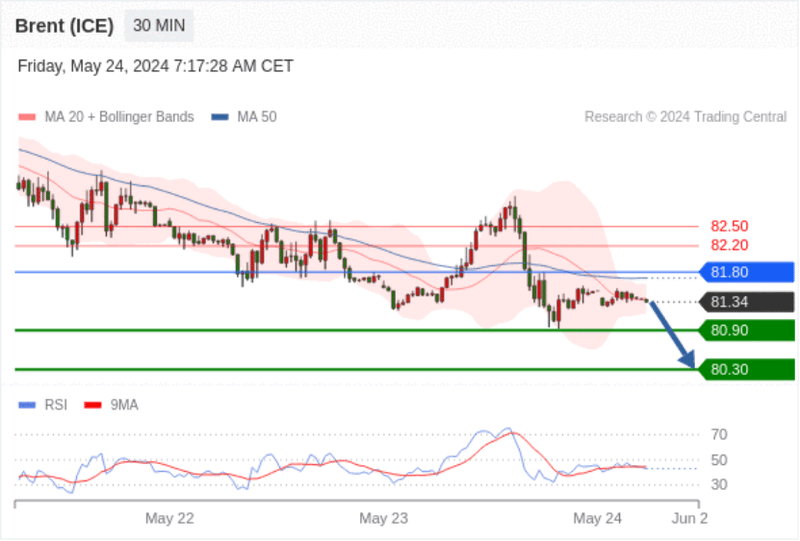
Brent Crude Oil (ICE) Intraday: Short-term key resistance at 81.80.
Pivot point:
81.80
Trading strategy:
Bearish below 81.80, target prices are 80.90, then 80.30.
Alternative strategy:
Bullish above 81.80, target prices are 82.20, then 82.50.
Technical commentary:
As long as resistance at 81.80 is not surpassed, the risk of a decline below 80.90 remains high.
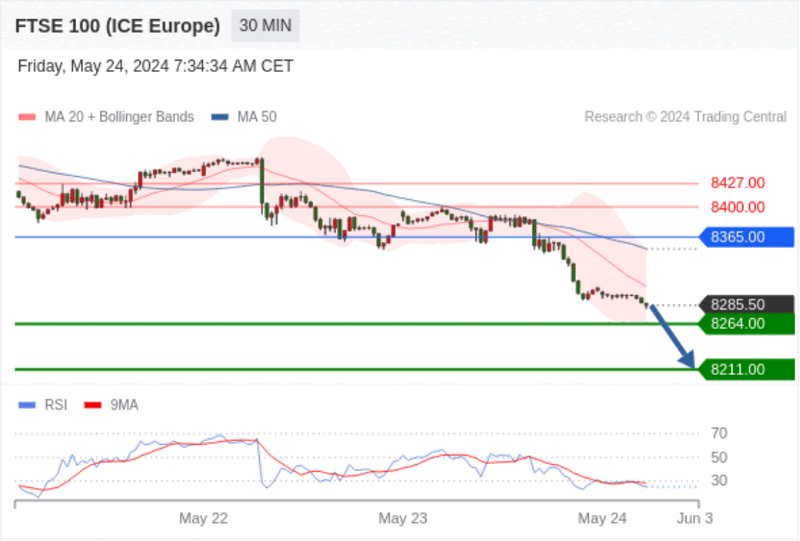
UK FTSE 100 Index Futures Intraday: Downtrend.
Pivot point:
8365.00
Trading strategy:
Bearish below 8365.00, target prices are 8264.00, then 8211.00.
Alternative strategy:
Bullish above 8365.00, target prices are 8400.00, then 8427.00.
Technical commentary:
The RSI indicator has fallen below the 30 level.