MT4 Indicators Quick Guide
There are three indicators in MT4:
- Analyst View (AV) -- The direction and target price levels suggested by analysts
- Candlestick Chart (AC) -- Buy and sell signals
- Adaptive Divergence Convergence (ADC) -- Buy and sell signals
A. - Referencing Analysts' Trend Recommendations
Analyst View
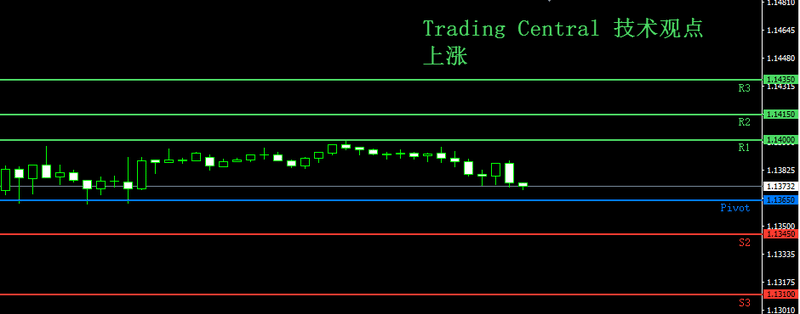
It is advised to first look at the Analyst View indicator, which will intuitively show the direction and target price levels recommended by our analysts on the chart. Detailed explanations of their viewpoints will be provided below.
- If our analysts' trend analysis points to an uptrend, R1/R2/R3 are the TC's target price levels. (If the trend analysis indicates a downtrend, then S1 is the target price level.) R1 is more conservative, while R2 is for those looking for aggressive target prices. Regarding risk management, investors generally consider closing half of their position once the first target price is reached, and consider closing the other half once the second target price is reached. R3 is a further resistance level, usually taken as a reference for short-term investment target price.
- Another important feature is the blue pivot point. If the market does not perform as expected and reaches this pivot point, analysts believe that the market's outlook has reversed. Therefore, the pivot point is often suggested as a stop-loss level.
- Then, S2/S3 are the levels that the price might reach if the market's outlook has reversed. (If the trend is downward, then R2 becomes the target price level for when the trend reverses.)
- When investing, technical analysis usually starts with evaluating the risk-reward ratio. If the risk is high but the reward is low, it's better to wait for a better price. Operations can be considered if the risk-reward ratio is greater than 1.5, meaning the investment is more cost-effective. If the return on this investment is minimal with high risk, then it is not worthwhile.
After identifying the trend recommended by the analyst, investors can combine the Analyst View with the Japanese candlestick chart or TC's proprietary ADC indicator. Both indicators have their advantages, detecting different buy and sell signals.
B: Referencing Buy and Sell Signals
i) Candlestick Chart
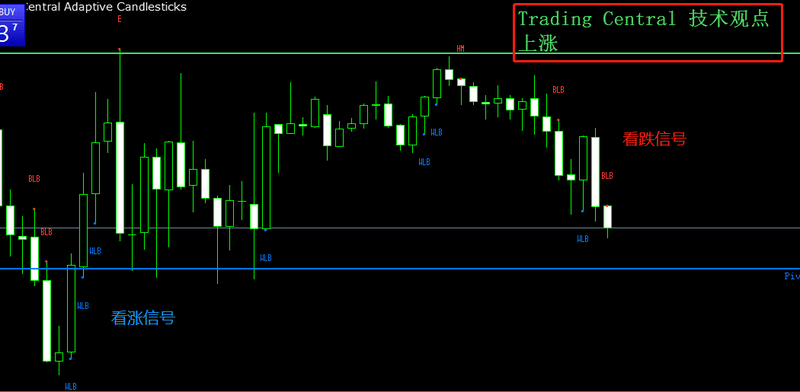
We can first move the candlestick chart indicator to the right side of the chart to view it alongside the analyst's viewpoint,
The candlestick chart indicator automatically searches for buy and sell signals, marking bearish signals with red and bullish signals with blue. Hovering over the signals will display their interpretations.
It is advised to first consider the analyst's trend viewpoint, as signals that align with the trend may be more reliable.
ii) ADC
Since both the ADC and candlestick chart indicators search for buy and sell signals, it is recommended to view the candlestick chart and ADC separately.
TC has developed its ADC indicator by combining MACD and RSI (Relative Strength Index). Although MACD is reliable, its reactivity is relatively weak. The new technical indicator ADC has stronger reactivity and a higher frequency of signals while retaining the stability of MACD.
The ADC indicator consists of three components. TC suggests focusing on the first component, Chart Price. Chart Price is a summary of the latter two and intuitively displays entry and exit buy and sell signals on the chart. Similar to the candlestick chart, hovering over it will reveal the signal's interpretation. If the ADC signal's direction matches the analyst's trend viewpoint, its reliability is enhanced.
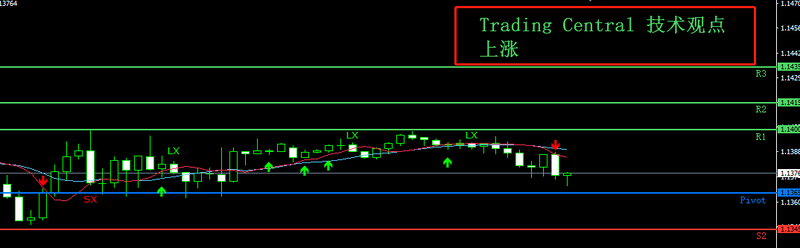
It's generally recommended for investors to first determine the trend based on the analyst's viewpoint, and then, by referencing the candlestick chart indicator or ADC indicator, consider the timing for entry. If the analyst's viewpoint is bullish, it is usually advisable to focus solely on bullish buy signals. Conversely, if the viewpoint is bearish, attention should be given exclusively to bearish trading signals.