FxPro Insights: Daily Technical Analysis before the European Market Opens on April 22, 2024
Explore today’s market perspectives from the Global Research Department of the Trading Center. Discover new trading methods and opportunities from popular trading products.
EUR/USD Spot Gold GBP/USD EUR/JPY EUR/GBP USD/CHF Germany DAX Index Futures (Eurex) Brent Crude (ICE) UK FTSE 100 Index Futures
Reminder: Due to market fluctuations, prices may have moved beyond key levels, rendering strategies ineffective.
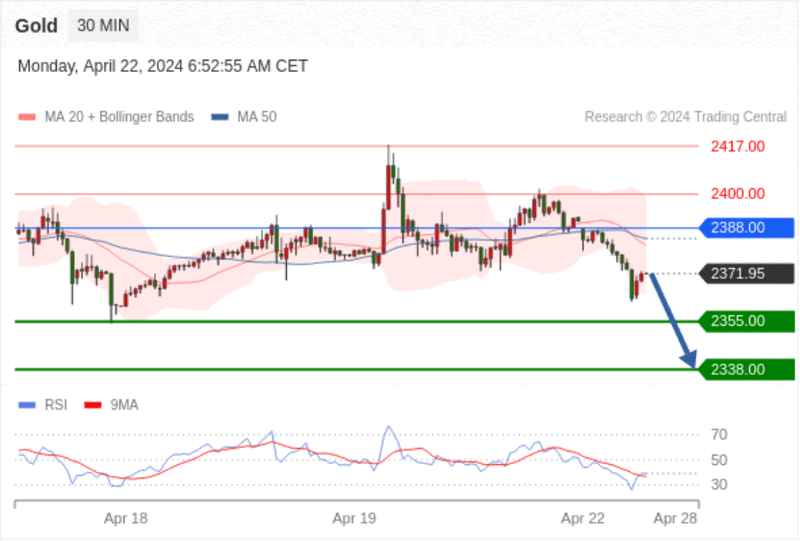
Spot Gold Intraday: Downtrend.
Pivot Point:
2388.00
Trading strategy:
Below 2388.00, target a bearish position with target prices at 2355.00, followed by 2338.00.
Alternative strategy:
Above 2388.00, target a bullish position with target prices at 2400.00, followed by 2417.00.
Technical Commentary:
The RSI indicator is bearish, suggesting a potential further downtrend.
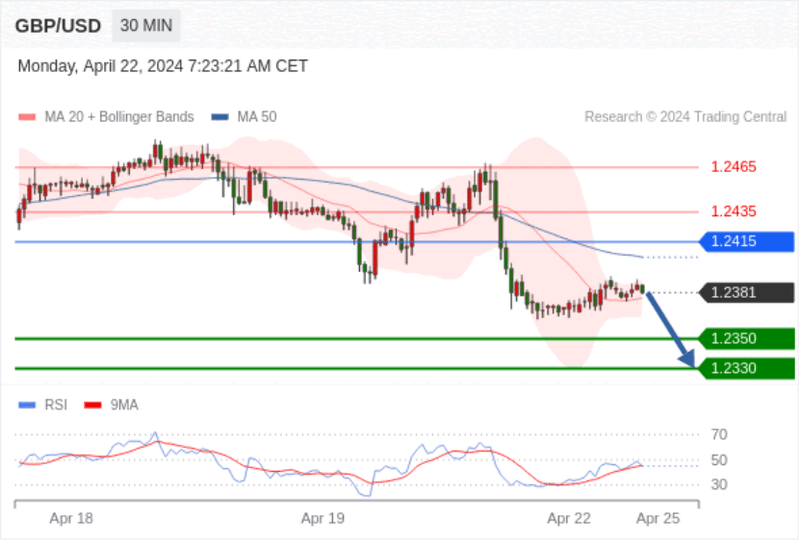
GBP/USD Intraday: Short-term key resistance at 1.2415.
Pivot Point:
1.2415
Trading strategy:
Below 1.2415, target a bearish position with target prices at 1.2350, followed by 1.2330.
Alternative strategy:
Above 1.2415, target a bullish position with target prices at 1.2435, followed by 1.2465.
Technical Commentary:
As long as the resistance at 1.2415 is not breached, the risk of a downturn breaking below 1.2350 is high.
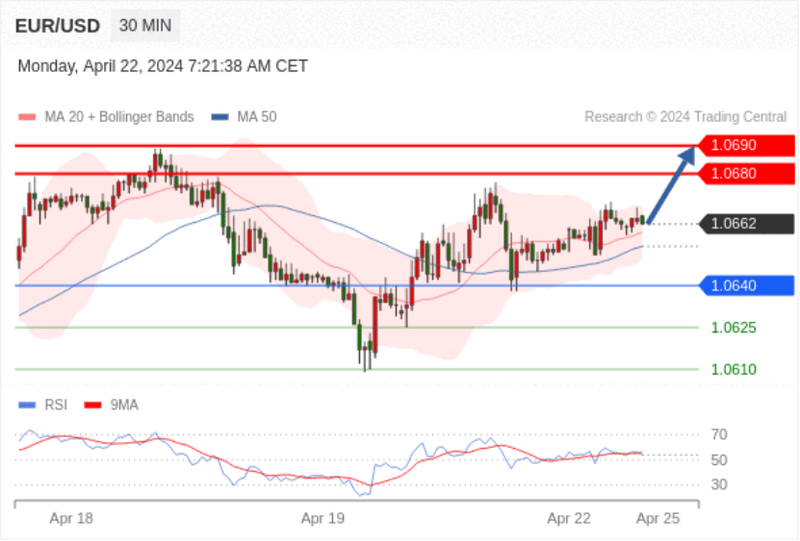
EUR/USD Intraday: Uptrend.
Pivot Point:
1.0640
Trading strategy:
Above 1.0640, target a bullish position with target prices at 1.0680, followed by 1.0690.
Alternative strategy:
Below 1.0640, target a bearish position with target prices at 1.0625, followed by 1.0610.
Technical Commentary:
The RSI indicator is moving upwards.
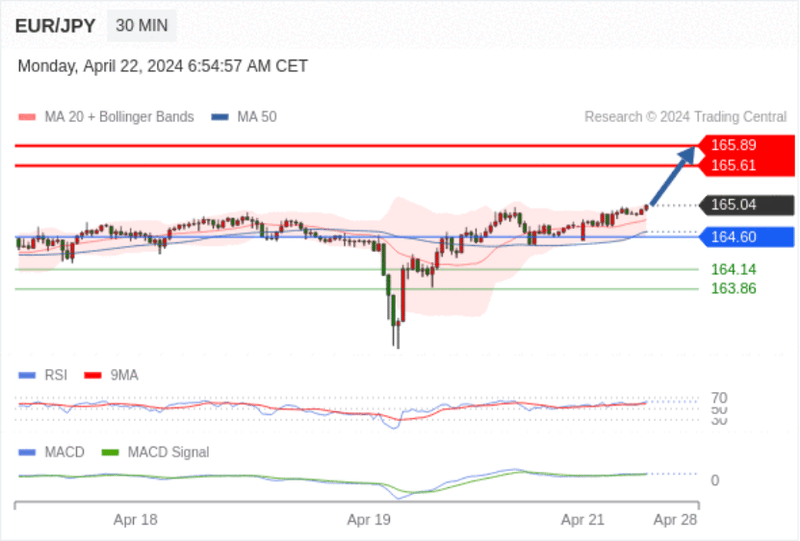
EUR/JPY Intraday: Bullish, with 164.60 as support.
Pivot Point: 164.60
Trading strategy:
Bullish, with 164.60 as support.
Alternative strategy:
If falling below 164.60, aim for EUR/JPY target direction at 164.14 and then 163.86.
Technical Commentary:
The RSI indicator is above the neutral 50 area. The MACD indicator is above its signal line, indicating bullish sentiment. Additionally, price positions are above their 20-day and 50-day moving averages (currently at 164.84 and 164.67 respectively).
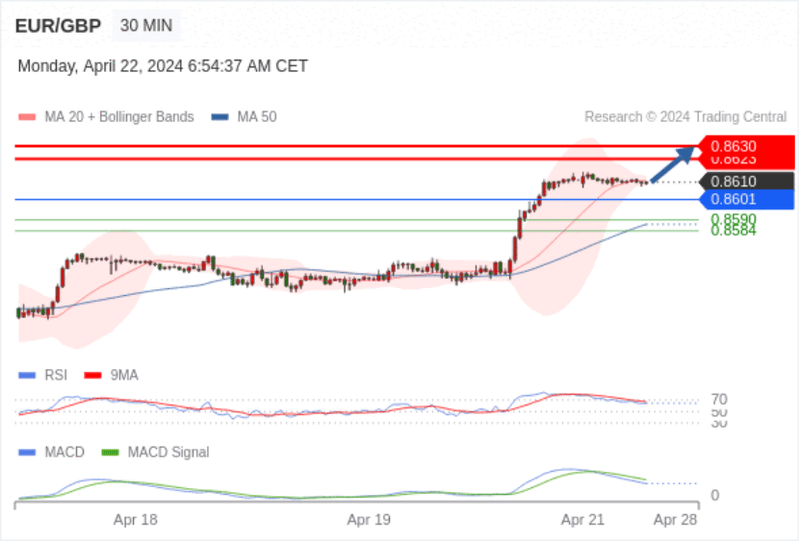
EUR/GBP Intraday: Bullish, with 0.8601 as support, targeting 0.8630.
Pivot Point is:
0.8601
Trading strategy:
Bullish, with 0.8601 as support, targeting 0.8630.
Alternative strategy:
If falling below 0.8601, aim for the EUR/GBP target direction at 0.8590 and then 0.8584.
Technical Commentary:
The RSI indicator is above 50. The MACD indicator is in a bullish state and below its signal line. Moreover, the price is below its 20-day moving average (0.8611) but above its 50-day moving average (0.8588).
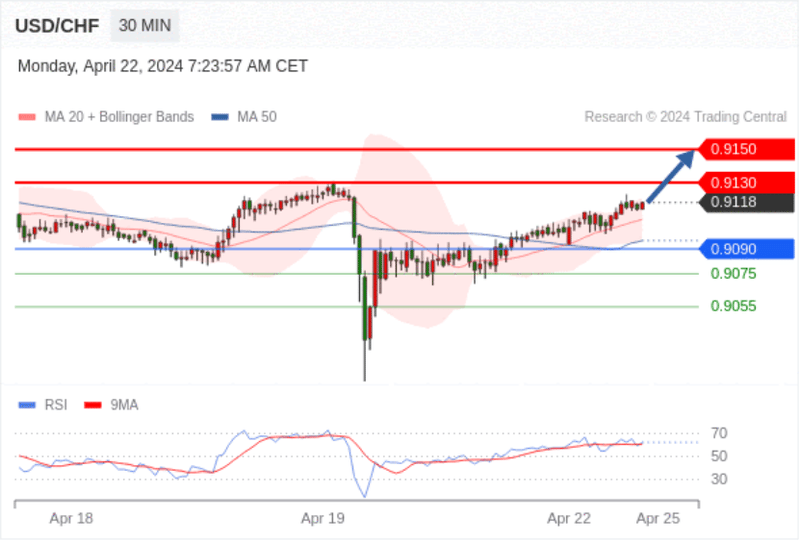
USD/CHF Intraday: Uptrend.
Pivot Point:
0.9090
Trading strategy:
Above 0.9090, target a bullish position with target prices at 0.9130, followed by 0.9150.
Alternative strategy:
Below 0.9090, target a bearish position with target prices at 0.9075, followed by 0.9055.
Technical Commentary:
The RSI indicator suggests a further upward trend.
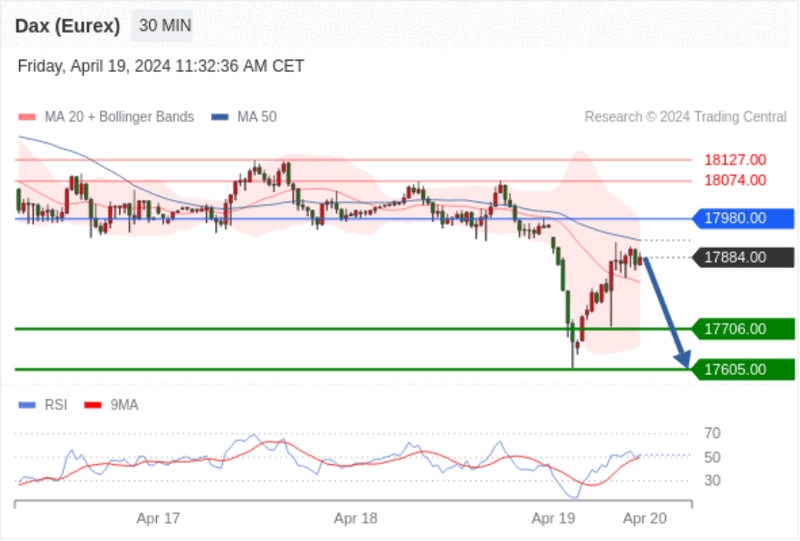
Germany DAX Index Futures (Eurex) (M4) Intraday: No significant trend.
Pivot Point:
17980.00
Trading strategy:
Below 17980.00, target a bearish position with target prices at 17706.00, followed by 17605.00.
Alternative strategy:
Above 17980.00, target a bullish position with target prices at 18074.00, followed by 18127.00.
Technical Commentary:
As long as the resistance at 17980.00 persists, there is a downward trend in price fluctuation.
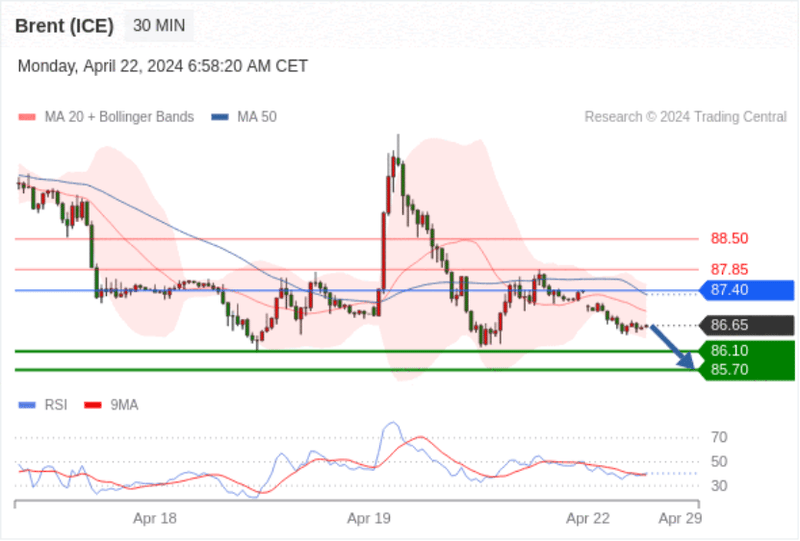
Brent Crude (ICE) (M4) Intraday: Targeting 85.70.
Pivot Point:
87.40
Trading strategy:
Below 87.40, target a bearish position with target prices at 86.10, followed by 85.70.
Alternative strategy:
Above 87.40, target a bullish position with target prices at 87.85, followed by 88.50.
Technical Commentary:
The RSI indicator suggests a further downward trend.
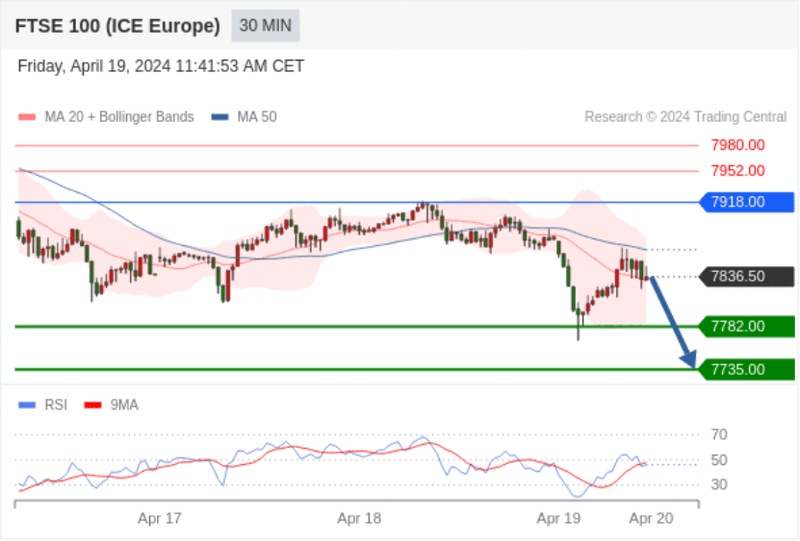
UK FTSE 100 Index Futures Intraday: Short-term key resistance at 7918.00.
Pivot Point:
7918.00
Trading strategy:
Below 7918.00, target a bearish position with target prices at 7782.00, followed by 7735.00.
Alternative strategy:
Above 7918.00, target a bullish position with target prices at 7952.00, followed by 7980.00.
Technical Commentary:
The RSI indicator is below the neutral 50% area.