Check out today's market perspectives from the global research department at the Trading Center. Explore new trading methods and opportunities from popular trading products.
EUR/USD Spot Gold GBP/USD EUR/JPY EUR/GBP USD/CHF German DAX Index Futures (Eurex) Brent Crude Oil (ICE) UK FTSE 100 Index Futures
Gentle reminder: Due to market fluctuations, prices may have passed key points, rendering strategies ineffective.
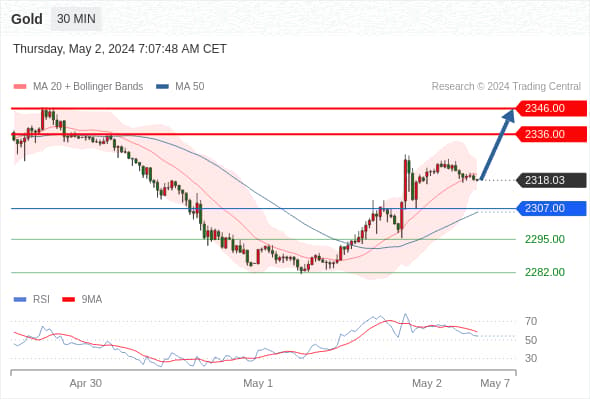
Spot Gold Intraday: Target at 2346.00.
Pivot Point:
2307.00
Trading Strategy:
Above 2307.00, bullish, with target levels at 2336.00 and then 2346.00.
Alternative Strategy:
Below 2307.00, bearish, with target levels at 2295.00 and then 2282.00.
Technical Commentary:
The RSI indicator shows a complicated trend leaning towards a rise.
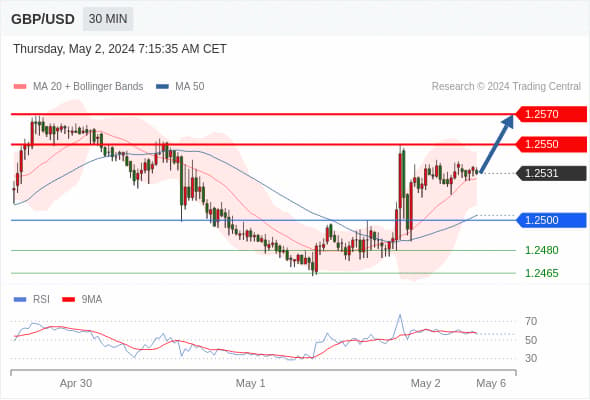
GBP/USD Intraday: Bullish above 1.2500.
Pivot Point:
1.2500
Trading Strategy:
Above 1.2500, bullish, with target levels at 1.2550 and then 1.2570.
Alternative Strategy:
Below 1.2500, bearish, with target levels at 1.2480 and then 1.2465.
Technical Commentary:
The RSI indicator shows a complicated trend leaning towards a rise.
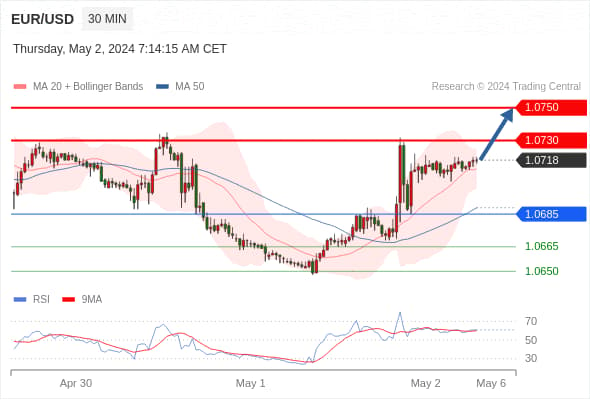
EUR/USD Intraday: Uptrend.
Pivot Point:
1.0685
Trading Strategy:
Above 1.0685, bullish, with target levels at 1.0730 and then 1.0750.
Alternative Strategy:
Below 1.0685, bearish, with target levels at 1.0665 and then 1.0650.
Technical Commentary:
The RSI indicator shows a complicated trend leaning towards a rise.
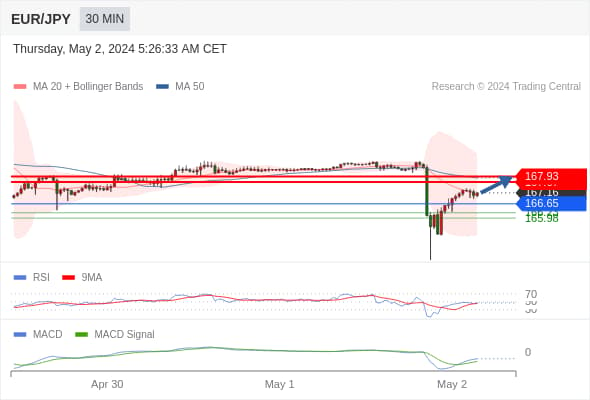
EUR/JPY Intraday: Possibility of a rise, with a target at 167.93.
Pivot at 166.65.
Trading Strategy:
Possibility of a rise, with a target at 167.93.
Alternative Strategy:
If it falls below 166.65, target levels for EUR/JPY set at 166.23 and 165.98.
Technical Commentary:
The RSI indicator is below the neutral 50 zone. MACD is bearish and above its signal line. Additionally, the price is below its 50-day moving average (167.86) but above its 20-day moving average (167.08).
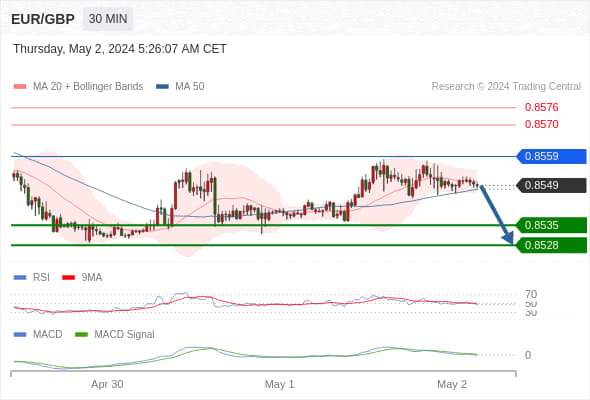
EUR/GBP Intraday: Gradual decline, with a target at 0.8528 if 0.8559 blocks upward movement.
Pivot Point set at:
0.8559
Trading Strategy:
Gradual decline, with a target at 0.8528 if 0.8559 blocks upward movement.
Alternative Strategy:
If it breaks above 0.8559, target levels for EUR/GBP at 0.8570 and 0.8576.
Technical Commentary:
The RSI indicator is below 50. MACD is bullish and below its signal line. Additionally, the price is below its 20-day moving average (0.8550) but above its 50-day moving average (0.8548).
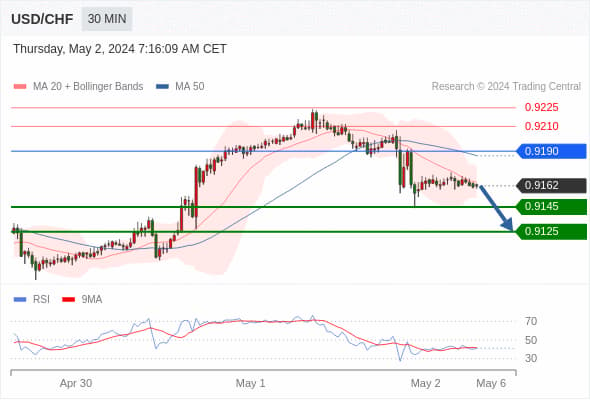
USD/CHF Intraday: Key short-term resistance at 0.9190.
Pivot Point:
0.9190
Trading Strategy:
Below 0.9190, bearish, with target levels at 0.9145 and then 0.9125.
Alternative Strategy:
Above 0.9190, bullish, with target levels at 0.9210 and then 0.9225.
Technical Commentary:
As long as the 0.9190 resistance is not broken, the risk of a decline to 0.9145 is significant.
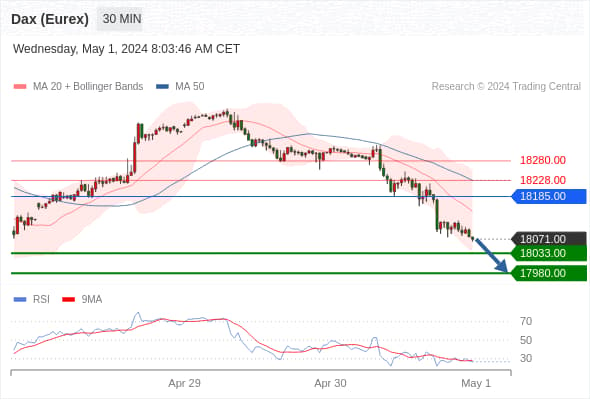
German DAX Index Futures (Eurex) (M4): Under pressure intraday.
Pivot Point:
18185.00
Trading Strategy:
Below 18185.00, bearish, with target levels at 18033.00 and then 17980.00.
Alternative Strategy:
Above 18185.00, bullish, with target levels at 18228.00 and then 18280.00.
Technical Commentary:
The RSI indicator has dropped below its 30 level.
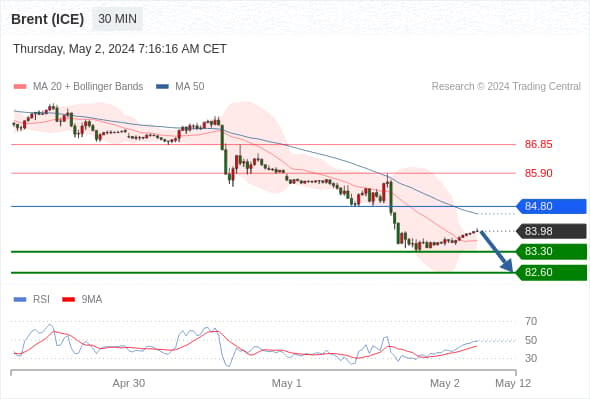
Brent Crude Oil (ICE) (N4) Intraday: Key short-term resistance at 84.80.
Pivot Point:
84.80
Trading Strategy:
Below 84.80, bearish, with target levels at 83.30 and then 82.60.
Alternative Strategy:
Above 84.80, bullish, with target levels at 85.90 and then 86.85.
Technical Commentary:
As long as the 84.80 resistance is not broken, the risk of a decline to 83.30 is significant.
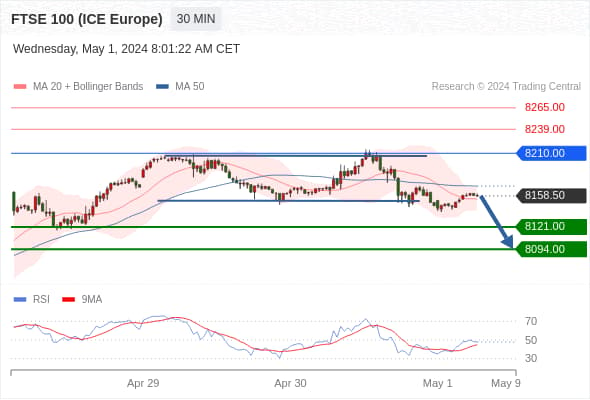
UK FTSE 100 Index Futures Intraday: Short-term adjustment.
Pivot Point:
8210.00
Trading Strategy:
Below 8210.00, bearish, with target levels at 8121.00 and then 8094.00.
Alternative Strategy:
Above 8210.00, bullish, with target levels at 8239.00 and then 8265.00.
Technical Commentary:
As long as the 8210.00 resistance exists, there's a bearish trend in price fluctuations.