Explore new trading methods and opportunities from popular trading products in the Global Research Department of the Trading Center's market perspective today.
EUR/USD GBP/USD Spot Gold EUR/JPY EUR/GBP USD/CHF German DAX Index Futures (Eurex) Brent Crude (ICE) UK FTSE 100 Index Futures
Note: Due to market fluctuations, prices may have moved past key points, rendering strategies ineffective.
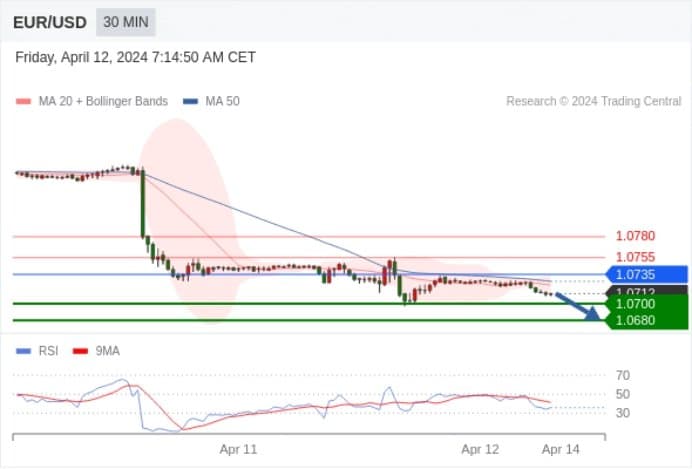
EUR/USD Today: Under pressure.
Pivot point:
1.0735
Trading strategy:
Below 1.0735, bearish with target levels at 1.0700, then 1.0680.
Alternative strategy:
Above 1.0735, bullish with target levels at 1.0755, then 1.0780.
Technical comment:
The RSI indicator shows a complex trend, tending towards a decline.
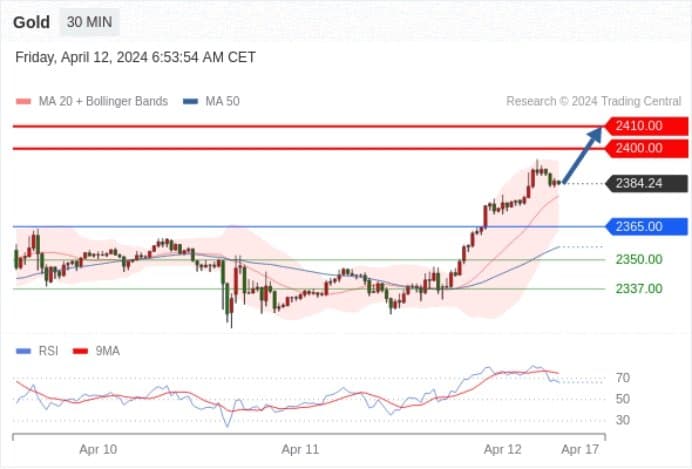
Spot Gold Today: Bullish trend.
Pivot point:
2365.00
Trading strategy:
Above 2365.00, bullish with target levels at 2400.00, then 2410.00.
Alternative strategy:
Below 2365.00, bearish with target levels at 2350.00, then 2337.00.
Technical comment:
The RSI indicator shows a continuing upward trend.
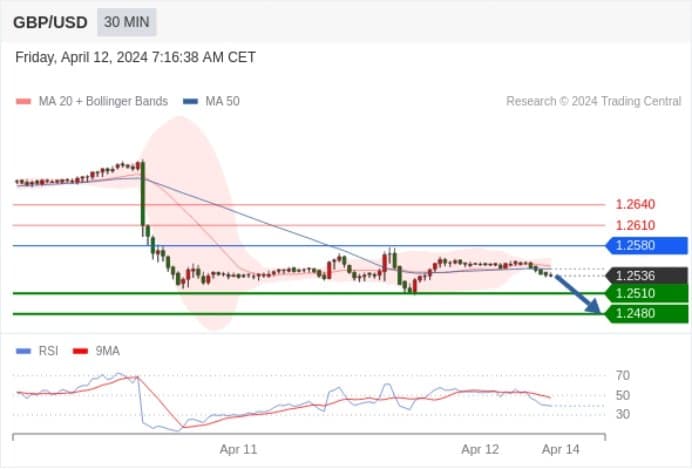
GBP/USD Today: Under pressure.
Pivot point:
1.2580
Trading strategy:
Below 1.2580, bearish with target levels at 1.2510, then 1.2480.
Alternative strategy:
Above 1.2580, bullish with target levels at 1.2610, then 1.2640.
Technical comment:
The RSI indicator shows a complex trend, tending towards a decline.
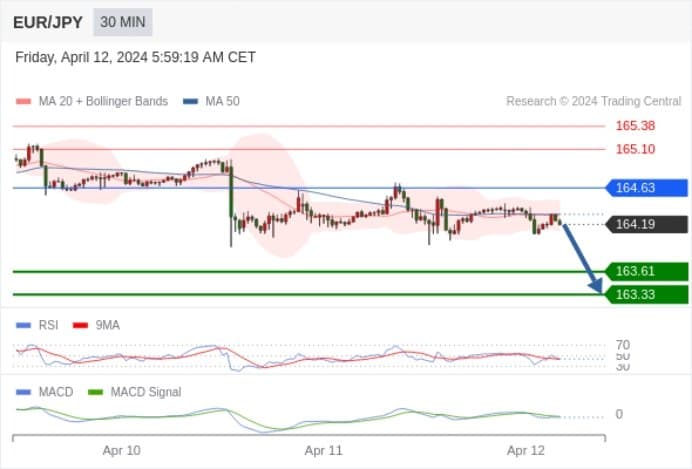
EUR/JPY Today: Bearish below 164.63.
Pivot point set at:
164.63
Trading strategy:
Bearish, below 164.63.
Alternative strategy:
If it breaks through 164.63, EUR/JPY targets are 165.10 and 165.38.
Technical comment:
RSI below 50. MACD below its signal line indicating bearish trend. Additionally, the price is below its 20-day and 50-day moving averages (currently at 164.29 and 164.31 respectively).
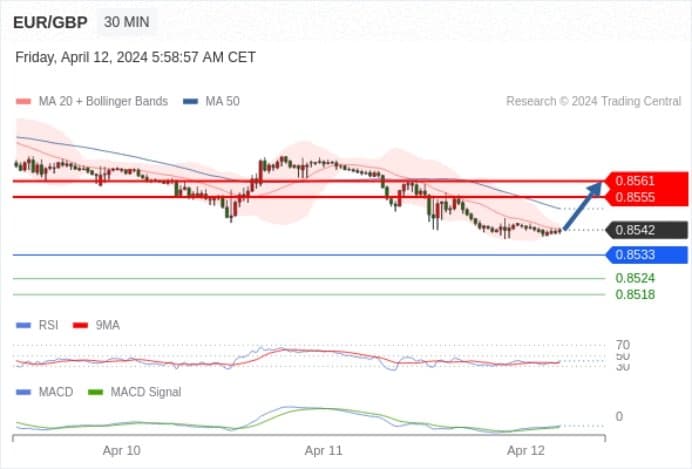
EUR/GBP Today: Potential rise, target at 0.8561.
Pivot point set at:
0.8533
Trading strategy:
Potential rise, target at 0.8561.
Alternative strategy:
Falling below 0.8533 could lead to continued downward trend, with targets at 0.8524 then 0.8518.
Technical comment:
RSI below 50. MACD is bearish and above its signal line. Moreover, the price is below its 20-day and 50-day moving averages (located at 0.8543 and 0.8551 respectively).
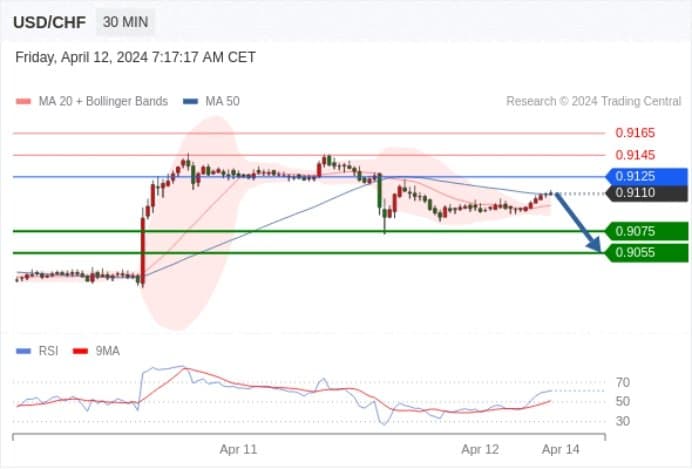
USD/CHF Today: Adjustment.
Pivot point:
0.9125
Trading strategy:
Below 0.9125, bearish with target levels at 0.9075, then 0.9055.
Alternative strategy:
Above 0.9125, bullish with target levels at 0.9145, then 0.9165.
Technical comment:
The RSI indicator lacks upward momentum
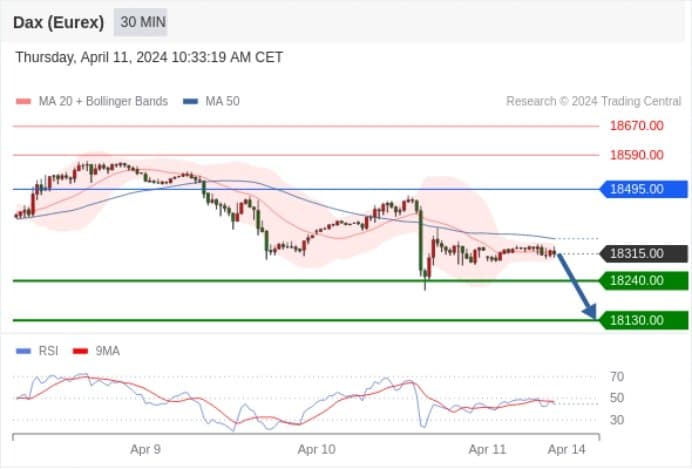
German DAX Index Futures (Eurex) Today: Under pressure.
Pivot point:
18495.00
Trading strategy:
Below 18495.00, bearish with target levels at 18240.00, then 18130.00.
Alternative strategy:
Above 18495.00, bullish with target levels at 18590.00, then 18670.00.
Technical comment:
As long as the resistance at 18495.00 is not breached, the risk of a decline below 18240.00 is high.
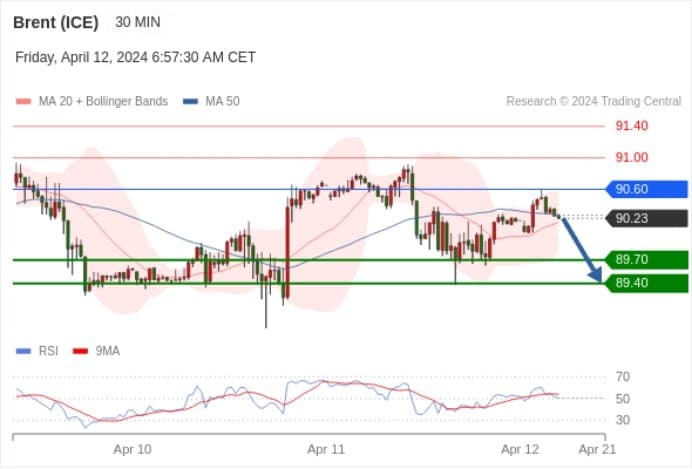
Brent Crude (ICE) Today: No clear trend.
Pivot point:
90.60
Trading strategy:
Below 90.60, bearish with target levels at 89.70, then 89.40.
Alternative strategy:
Above 90.60, bullish with target levels at 91.00, then 91.40.
Technical comment:
As long as the resistance at 90.60 exists, the price fluctuation tends to be bearish.
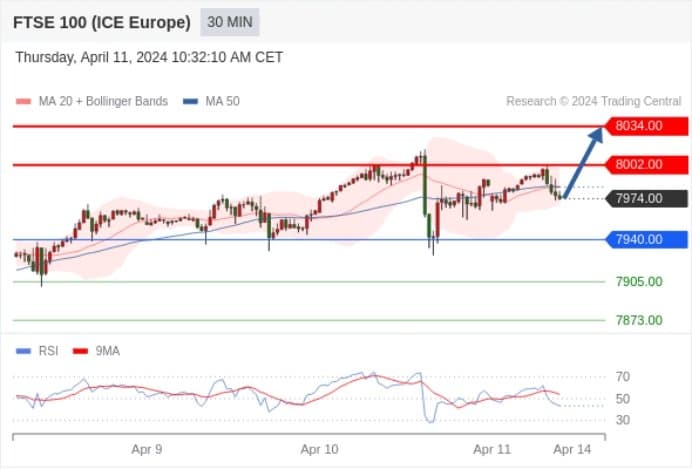
UK FTSE 100 Index Futures Today: Bullish trend.
Pivot point:
7940.00
Trading strategy:
Above 7940.00, bullish with target levels at 8002.00, then 8034.00.
Alternative strategy:
Below 7940.00, bearish with target levels at 7905.00, then 7873.00.
Technical comment:
The RSI indicator shows a complex trend, proceed with caution.