Explore the latest market insights from the global research department at the Trading Center today. Discover new trading methods and opportunities from popular trading products.
EUR/USD GBP/USD Spot Gold EUR/JPY EUR/GBP USD/CHF Germany DAX Index Futures (Eurex) Brent Crude (ICE) UK FTSE 100 Index Futures
Note: Due to market volatility, prices may have crossed key levels, rendering strategies ineffective.
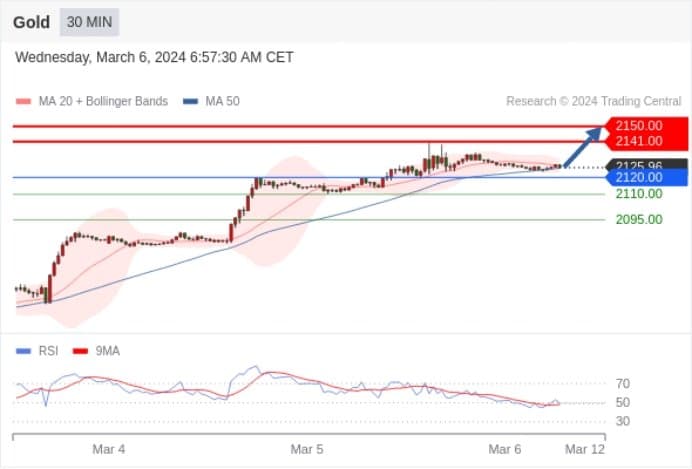
Spot Gold Today: Ultra-short term (intraday) support around 2120.00.
Pivot Point:
2120.00
Trading Strategy:
Bullish above 2120.00, with target levels at 2141.00, followed by 2150.00.
Alternative Strategy:
Bearish below 2120.00, with target levels at 2110.00, followed by 2095.00.
Technical Commentary:
Ultra-short term (intraday) technical indicators are complex, proceed with caution.
![9c683f29-1e13-4cf9-9b95-0d4bb4cb00eb](https://production-app-asset.traderknows.com/images/22dc6170f8034bd98aece0180600a229.width-800.jpg?Expires=1724652564&Signature=pQDRnBIIzHXf2LF5XksUIbv2kbxdm48F9cZiJ0hUeLjsDfj7nJ7vTLOPYDbYPGu2TX8vEFGWKQRBAOg-j-rfa4PR2qCrVTZNEg1zVHrpWIJ-gpCyb8-2G5NIIrLwlUmuGs8hXR4c0xQRNrMP9utcOJaKNXZy9jXMFHIbdoDlbOXd2F4bfKfeC5qJ0NXlxh332HA-mx1A9hvPDfgSczQp2WXpLt2KaYRlXMyXhjDP~yNFxGlX0RyT3Bs~ARHUgJFz22hTpbERtHSdF67pvGhwzFt1uh1AJoOlJX-Oo6IdtWQQLZHfnd4-lM4bxDkjP79w5n939n0c5Zzo1SUMh8ZOoQ__&Key-Pair-Id=K3LHBTUA5A7KEY)
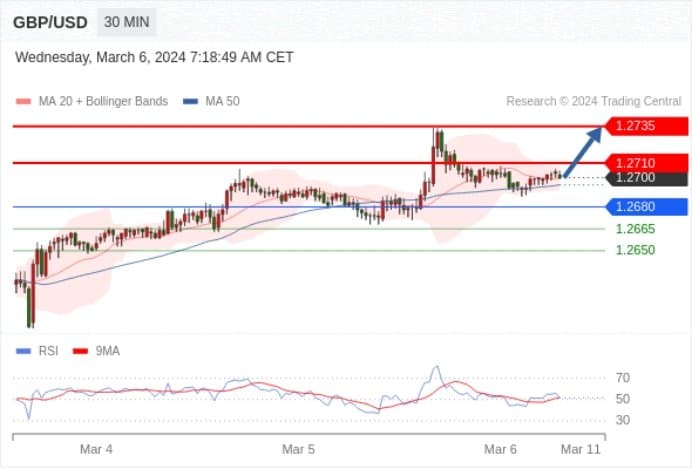
GBP/USD Today: Uptrend.
Pivot Point:
1.2680
Trading Strategy:
Bullish above 1.2680, with target levels at 1.2710, followed by 1.2735.
Alternative Strategy:
Bearish below 1.2680, with target levels at 1.2665, followed by 1.2650.
Technical Commentary:
RSI technical indicators are complex, showing a tendency to rise.
![9ff43708-1233-432b-91f9-0566d186b611](https://production-app-asset.traderknows.com/images/53dde394f6464ec39c867a03d43c30ed.width-800.jpg?Expires=1724652564&Signature=VfJVCG4cuVzcqoGTq5asXBU5csFJB3Y7HbvvJNbZMqnkziw3ES4pHS20hzSEiuXjpvVtz9-9g5cO9Yf8EDU534sUt4e1-njumcJj0qAYYsG06pmz~U1TWlMmUxsziAxPOK18NO~ihCQuEBfkz1NEgPxr7NgsaySIk~3qTBvNKuQN0onqISnnpG6lSt~mcHIPQ51lzbe-FAwgBK-ezzl7sg1LoJ9cbgxDB66I2ik9WiFARsHxaU6whQ9q-MXTlXgqu-OSKRS6LAHOf4XvvhNl8-Wf2ATruA50cI~wF-auQNw63RRAzkMOLco4F8C9JoMUA5wQdwD~5qWaVdfraumHMQ__&Key-Pair-Id=K3LHBTUA5A7KEY)
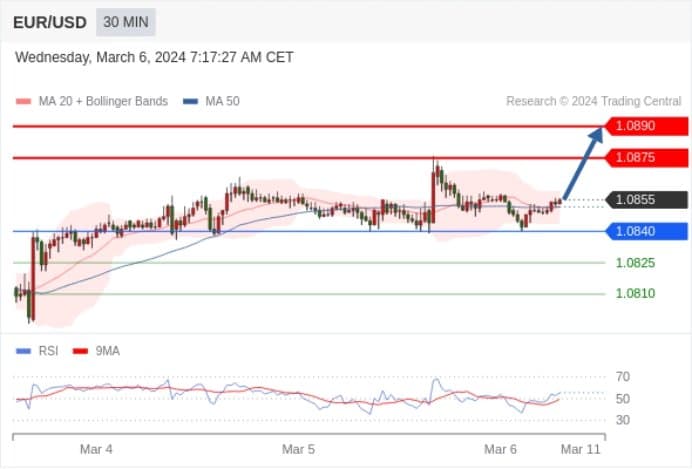
EUR/USD Today: Uptrend.
Pivot Point:
1.0840
Trading Strategy:
Bullish above 1.0840, with target levels at 1.0875, followed by 1.0890.
Alternative Strategy:
Bearish below 1.0840, with target levels at 1.0825, followed by 1.0810.
Technical Commentary:
RSI technical indicators are trending upwards.
![b7925f6a-928f-4bdd-b508-c0b26a287704](https://production-app-asset.traderknows.com/images/6754209c8fa445a9ae9c258607a9480e.width-800.jpg?Expires=1724652564&Signature=Sdjjcqn7eB35-V5U-PT54gWiEv5RXaoKEN4y63BPb2wV6dtwsGaD4ZzT6~PEE2GIa0BmMCP2u~uK6I~Ga0bK5UU8nFJ3kP0FvnUpKM62SNXtnkMqj1wl~v91G5H2An1JqU0xfEofcz6~BqdADAK13rbrrPPC94Cjnr2HhZOB2dVSJoKGipAOS1zNC~SdNLJuLHkIinnN2F3Pt48VEkaNf6eZ5ChGt3uLl0HWzkg1aNqIU9M-yr99pX54wZdGkkmBBtEgo0QcpcRpMhctV6-4m8r7kh06jswCmSzQrlwnF6UnHeAlpJSBi8Pg7o6-K-XZomr6EdK0buVe1ZQk8~wq3w__&Key-Pair-Id=K3LHBTUA5A7KEY)
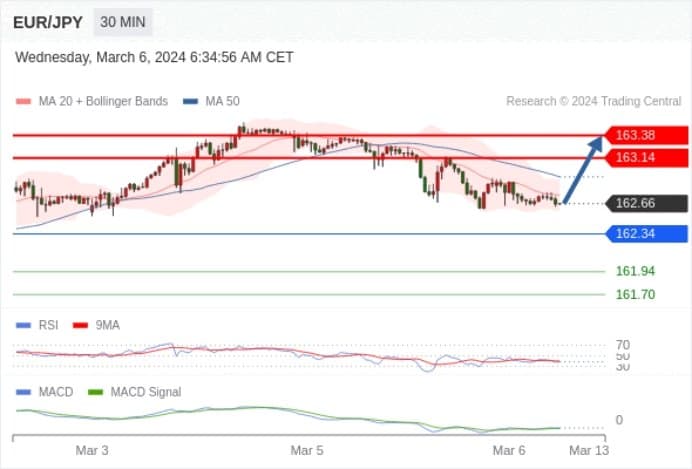
EUR/JPY Today: Possible rise, with a target level at 163.38.
Pivot Point: 162.34.
Trading Strategy:
Possible rise, with a target level at 163.38.
Alternative Strategy:
A break below 162.34 may trigger a downtrend, with target levels at 161.94, followed by 161.70.
Technical Commentary:
RSI technical indicators are below the neutral zone of 50. MACD indicators are bearish, above their signal line. Additionally, the price is below its 20-day and 50-day moving averages (located at 162.75 and 162.94 respectively).
![531cdb4e-6463-4530-a39c-30dd1a811a67](https://production-app-asset.traderknows.com/images/4c6c24a7255b4e66b1cd82edbe458409.width-800.jpg?Expires=1724652564&Signature=KO7UqRD~jUDStiabK3C9cSGaD14BnnbQs4afphnXvLy4DEsPBkGDu~lFaOYfGe7eF2h0Usiq6NQZ53I7zbkEEZ6~io962gGrvxUqo-cdUhuB4I37myi4giW0j6S2Fi4glJdpv8an7MwGFI8he4A8ttm8~io2rf-PE8gM4J6oeXZtAlxQ82zM5OlWhotNkV09UkQXEUbrUicrAuXbLlX3EbpMWJzG0pZouWgciRxXMquE~k0Mp-HsJqNtaxPk-1V310xt5oljIKkS9HoH8be03lRsUXoZbb4S7ZnQlSoHGdPtqCiXXe9cVPDTLD0eMQrAESu1ZIVthQAbqrVHBY-lOA__&Key-Pair-Id=K3LHBTUA5A7KEY)
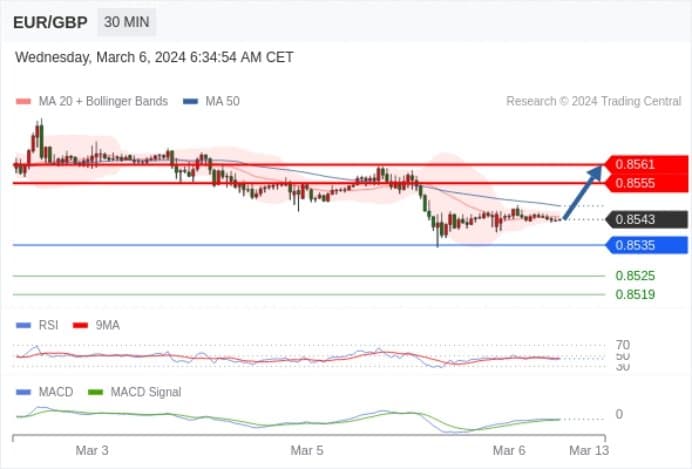
EUR/GBP Today: Possible rise, with a target level at 0.8561.
Pivot Point:
0.8535
Trading Strategy:
Possible rise, with a target level at 0.8561.
Alternative Strategy:
A break below 0.8535 targets the EUR/GBP at 0.8525 and 0.8519.
Technical Commentary:
RSI technical indicators are below 50. MACD indicators are bearish, above their signal line. Furthermore, the price is below its 20-day and 50-day moving averages (currently at 0.8544 and 0.8548).
![443d7a00-362e-4be6-9ed6-1e835fe52372](https://production-app-asset.traderknows.com/images/7c2acfba5d614a37bb63186fdacf83fc.width-800.jpg?Expires=1724652564&Signature=ZDd1IeKq4h7MJDv0iQ7mgbc7oqO3pKYzIIDBJ9-Jp9d1e1ApIgbLOqmaXGZK5iacy1IMoN9QtQzqEhzsV3-RMZ0VMFp5hUjUdonvVGszxAnoZLUGHg7v44Z0bKME7KrZdw-3IZQG3oejNBphGthCfU0lDasNBWUApmuTzrQCdSlyDqpx4NauxoMOiGKpIm-L7tUoAVzbsTs-zQSpAPxBJm1wf11YLHNxgn5pv9Tj6vC3t0AKGUnMhJ4h0qAY0-fni04SILMp~S30BiILE8iRmPeUBDIr4ZAxIJzX7~qlKHT5SGILbGwvMqdgJOgyiqQQfFpXXAe52keuzj0kwEAA5A__&Key-Pair-Id=K3LHBTUA5A7KEY)
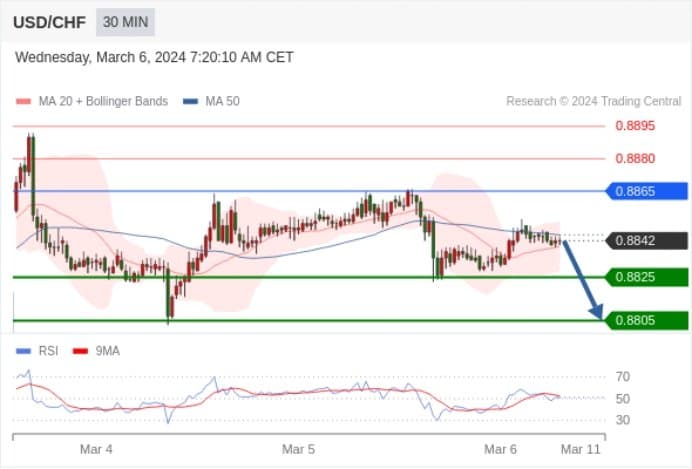
USD/CHF Today: Adjustment.
Pivot Point:
0.8865
Trading Strategy:
Bearish below 0.8865, with target levels at 0.8825, followed by 0.8805.
Alternative Strategy:
Bullish above 0.8865, with target levels at 0.8880, followed by 0.8895.
Technical Commentary:
RSI technical indicators are complex, showing a tendency to fall.
![c506ca94-9ad8-45e7-a967-f93a2ffa2b15](https://production-app-asset.traderknows.com/images/9d5b09efaa724ed8addf99298c12b78d.width-800.jpg?Expires=1724652564&Signature=ywDytZPVkPVNDLbXoMaSMyAL57yk9GLgMUIByWTSTwyI3tptNQtHvZ3RQSeOVPsrgDhy8cgkgiHX56wv2xGgWTjuMbeif5x9~JwfuZlG5CG2W5tmQxKwaLnKFAjceZ7E4rc~i-5j3-0QJdZrQj-VvNjvDKD5TdSzbi~QuBfrTb3NZdhfX~vw7EPMENuzI4HCy58IzHnmja2mwWOzHYHB0qn1hlwgW2KiSZZxnF~X6gTL5A-lC8xsmvRkNjQc9k3WRKSRsd9mS29Elo~SeHSa9ioHUvPOXxiHgQcM0E7SK~BRFXp2miMmtkEBQZfsmSgMlHvwerMsNECu3IIWDc1wBg__&Key-Pair-Id=K3LHBTUA5A7KEY)
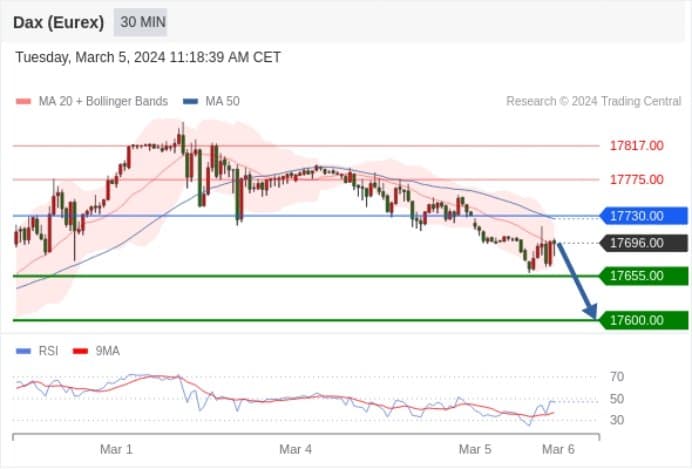
Germany DAX Index Futures (Eurex) (H4) Today: Short-term adjustment.
Pivot Point:
17730.00
Trading Strategy:
Bearish below 17730.00, with target levels at 17655.00, followed by 17600.00.
Alternative Strategy:
Bullish above 17730.00, with target levels at 17775.00, followed by 17817.00.
Technical Commentary:
As long as the resistance at 17730.00 remains, there's a bearish trend in price fluctuations.
![df3a4a67-923a-4d48-852a-ff64e8867eb9](https://production-app-asset.traderknows.com/images/e0f9ac3cfd2d4ae6b46f5aa80b48f298.width-800.jpg?Expires=1724652564&Signature=AmhlWeAbi0H8KoYFvpfece8MT4AGiEzJ7oBKU7vSnQzIL-A-BSUdXFvBaYMaQLr9F~0dJ4H-Y2rZvCqGCaQJmsHJlJ0nctMAlBr67HjoruTKopqRx0BEmA2lPResIQT370GF494WmEWFHIupSulnX8iLyDuSzZzdP-1tWgKw4hrw9ekBfhLk7keq~Vw3B2BEQq-O532Poz8UxQHA9UeHVa1ChAfQoCjrDdVKYIPNZayOX7shq9SF1Wl4-2KgYglTRONBirs6m7cdrlwWf--NUpJbSV4EmRxaFe~~jZXcbj7hN~x6C-JxAQ-7VhvZwT-xkXEPKjdmhysWXnDLVJlDAw__&Key-Pair-Id=K3LHBTUA5A7KEY)
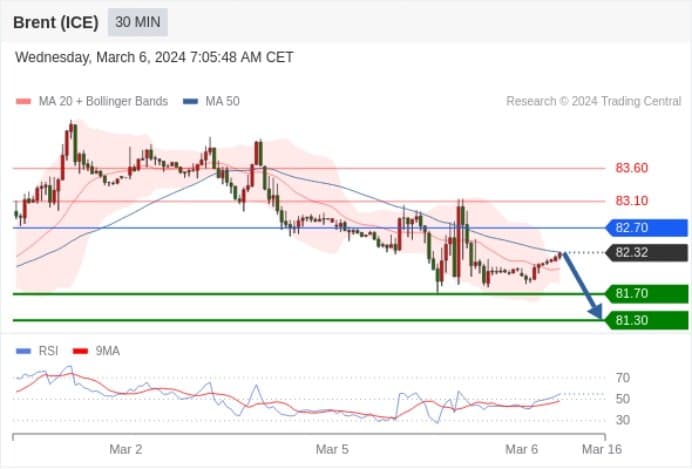
Brent Crude (ICE) (K4) Today: No significant change in trend.
Pivot Point:
82.70
Trading Strategy:
Bearish below 82.70, with target levels at 81.70, followed by 81.30.
Alternative Strategy:
Bullish above 82.70, with target levels at 83.10, followed by 83.60.
Technical Commentary:
As long as the resistance at 82.70 remains, there's a bearish trend in price fluctuations.
![d9989d48-3d0b-4e5b-9c8c-899db90964f2](https://production-app-asset.traderknows.com/images/4b8c5453d1ce4eee9507aa43a1e3aad2.width-800.jpg?Expires=1724652564&Signature=Ur1TmlVzFsi8ociBGpa0jIH~aSo3IJtPp-myHhwEV5UBcZW8plAx0NwEtZRcHFJRc66xhnrBqBfoQloYqAHXHdBUYoYMmyH8JAo7Ml5VNdnVa9riktPkR9YLshi89kfxCWof1Rr7BQFoQPJZhvHWvdk6yKi0vfj4Zl-JUpVooV02BtiRIOo1AQUutfYIB62LctD~nvbraGLDrDV3jL6j5tV-b~xWHyW5IgC5axBJAuc2DW5eIoRVcqh89q5THYXWihVBuXRHOs41KRGtRoMQuS9HMHjnVbQI0Yog-I4gLCYn9gi32Q2b0hCrg1Q5IvIDm4AScRU2TnmHMmjW87iVEQ__&Key-Pair-Id=K3LHBTUA5A7KEY)
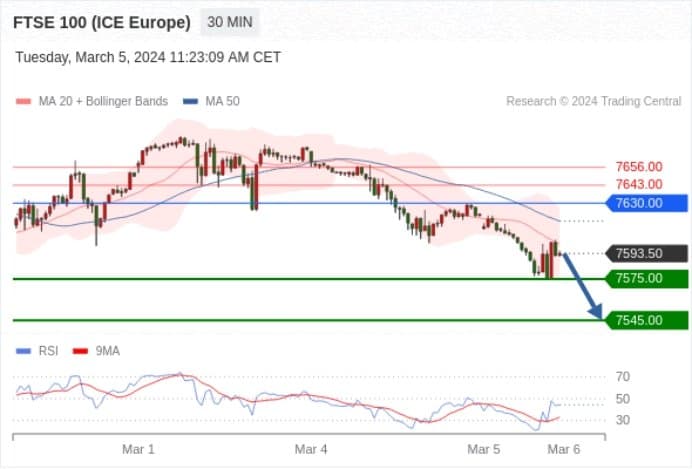
UK FTSE 100 Index Futures Today: Short-term key resistance at 7630.00.
Pivot Point:
7630.00
Trading Strategy:
Bearish below 7630.00, with target levels at 7575.00, followed by 7545.00.
Alternative Strategy:
Bullish above 7630.00, with target levels at 7643.00, followed by 7656.00.
Technical Commentary:
As long as the resistance at 7630.00 remains, there's a bearish trend in price fluctuations.
![fa7d4935-fabd-4b42-bed4-559387b739a3](https://production-app-asset.traderknows.com/images/d5e5fbdccff14478a4f20f756f0cb4e1.width-800.jpg?Expires=1724652564&Signature=FmR3Wum5xvflH67wF-SPF9~ttvQpm4uP6jPJr3NX3du~356vP4f8o7sTYcQadqBVTXpZBk38f9WeHCFiZ2g7OdrwM~mt7LRW-BmHo63SSfLStdhdjpYXK-XccHChfRjxbK2cUvEpRYZoty2SboTZdCU82ky~MIZ26KA5j5I~cXjQwyS3lEzzCtbSH3sFlRzd5ilpQNvXBi-Nej3bkxwWDnCZDxOwwQeEPIP0aYp0DMsNVwybkoPV~iT3MTwPURJAsp8lxg39Fk~CQzvpOmPSmRT9UvFEgZ3M-lK8NYEnnuBgi3OW0QYdI2UK2KwrFCdvyLgFFdKFLZSyd3fEznZ8Tg__&Key-Pair-Id=K3LHBTUA5A7KEY)