FxPro: Daily Technical Analysis Before the European Market Opens, May 22, 2024
Check out today's market insights from our Global Research Department at Trading Central. Discover new trading approaches and opportunities from popular trading products.
EUR/USD Spot Gold GBP/USD EUR/JPY EUR/GBP USD/CHF German DAX Futures (Eurex) Brent Oil (ICE) UK FTSE 100 Futures
Note: Due to market volatility, prices may have crossed key levels, rendering the strategy invalid.
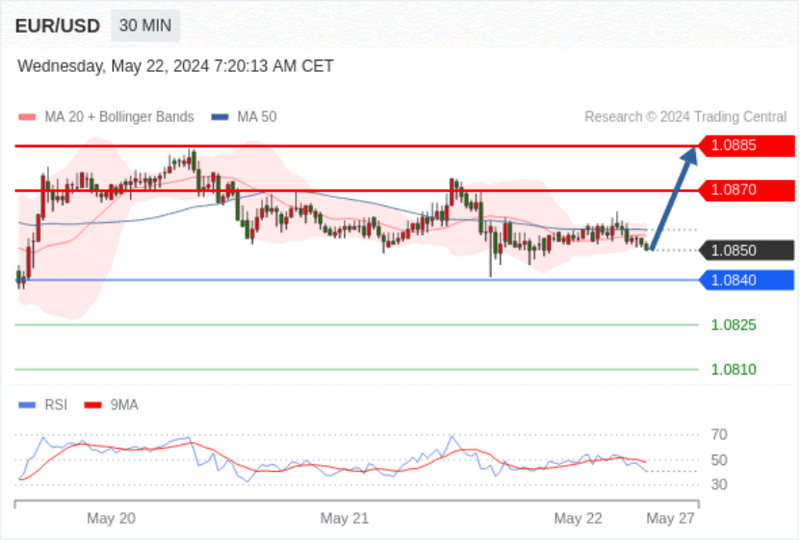
EUR/USD Intraday: Ultra-short-term support at 1.0840.
Pivot point:
1.0840
Trading strategy:
Above 1.0840, target 1.0870 then 1.0885.
Alternative strategy:
Below 1.0840, target 1.0825 then 1.0810.
Technical analysis:
While a further adjustment cannot be ruled out, the duration should be limited.
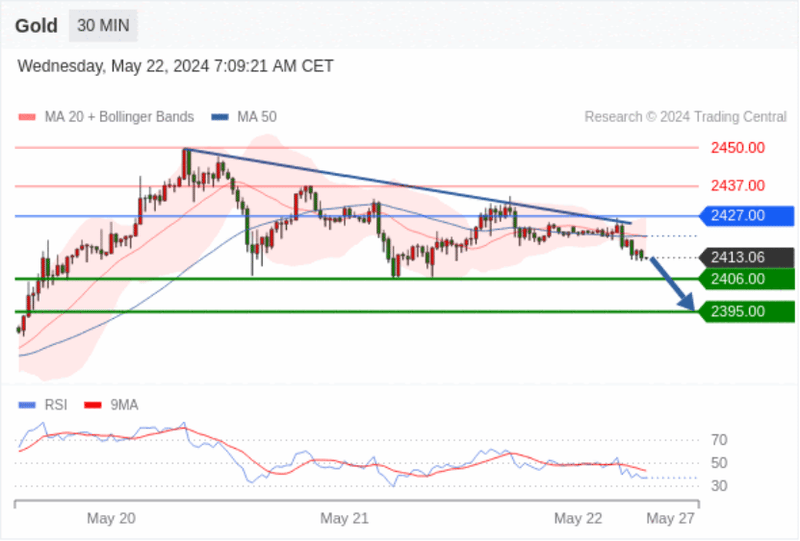
Spot Gold Intraday: Short-term key resistance at 2427.00.
Pivot point:
2427.00
Trading strategy:
Below 2427.00, target 2406.00 then 2395.00.
Alternative strategy:
Above 2427.00, target 2437.00 then 2450.00.
Technical analysis:
As long as the resistance at 2427.00 is not surpassed, the risk of breaking through 2406.00 to the downside is high.
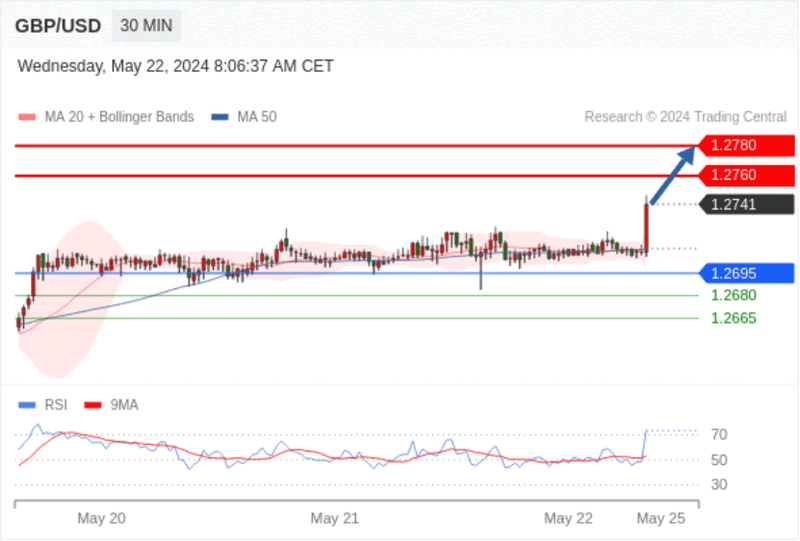
GBP/USD Intraday: Bullish above 1.2695.
Pivot point:
1.2695
Trading strategy:
Above 1.2695, target 1.2760 then 1.2780.
Alternative strategy:
Below 1.2695, target 1.2680 then 1.2665.
Technical analysis:
The RSI technical indicator is trending upwards.
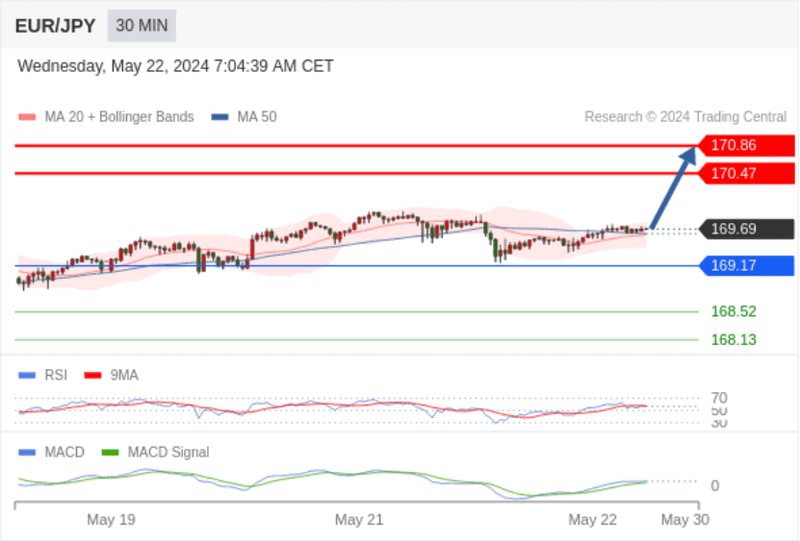
EUR/JPY Intraday: Bullish, with 169.17 as support.
Pivot point:
169.17
Trading strategy:
Bullish, with 169.17 as support.
Alternative strategy:
A break below 169.17 will bring a continued downward trend, targeting 168.52 then 168.13.
Technical analysis:
The RSI technical indicator is above the neutral area at 50. The MACD technical indicator is above its signal line, indicating a bullish trend. Additionally, prices are above their 20-day and 50-day moving averages (at 169.61 and 169.62, respectively).
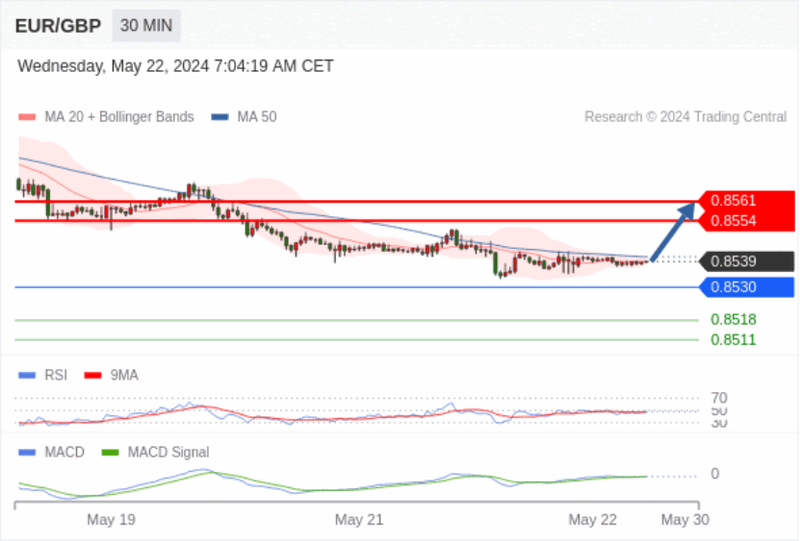
EUR/GBP Intraday: Potential for an upward movement, target at 0.8561.
Pivot point:
0.8530
Trading strategy:
Potential for an upward movement, target at 0.8561.
Alternative strategy:
A break below 0.8530 will bring a continued downward trend, targeting 0.8518 then 0.8511.
The RSI technical indicator is below the neutral area at 50. The MACD technical indicator is above its signal line, indicating a bearish trend. Additionally, prices are below their 20-day and 50-day moving averages (at 0.8539 and 0.8541, respectively).
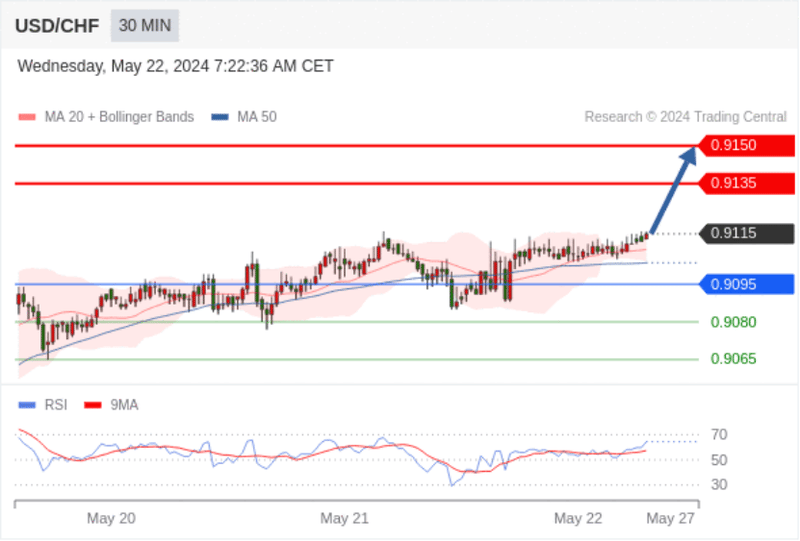
USD/CHF Intraday: Upward trend.
Pivot point:
0.9095
Trading strategy:
Above 0.9095, target 0.9135 then 0.9150.
Alternative strategy:
Below 0.9095, target 0.9080 then 0.9065.
Technical analysis:
The RSI technical indicator is trending upwards.
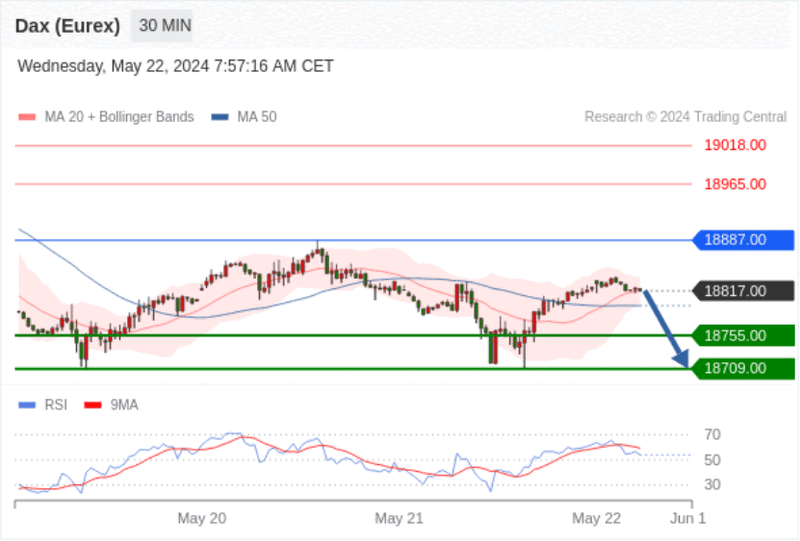
German DAX Futures (Eurex) Intraday: Short-term key resistance at 18887.00.
Pivot point:
18887.00
Trading strategy:
Below 18887.00, target 18755.00 then 18709.00.
Alternative strategy:
Above 18887.00, target 18965.00 then 19018.00.
Technical analysis:
As long as the resistance at 18887.00 remains, bearish price movement is likely.
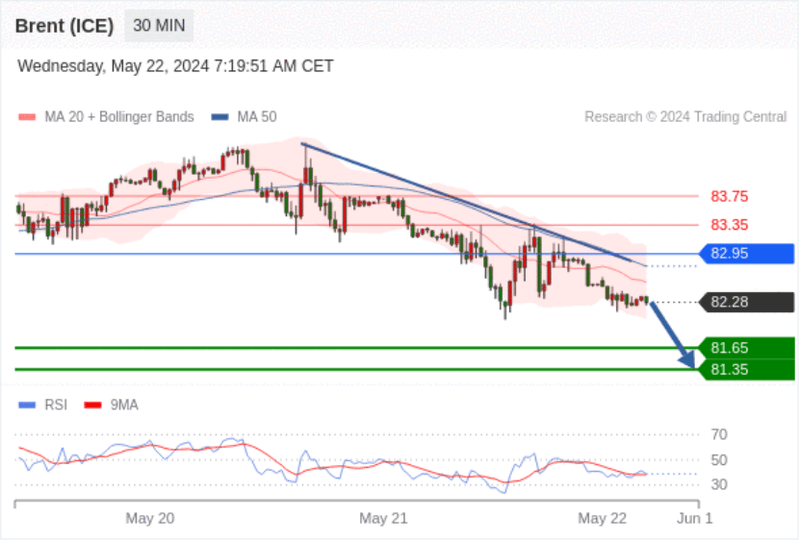
Brent Oil (ICE) Intraday: Under pressure.
Pivot point:
82.95
Trading strategy:
Below 82.95, target 81.65 then 81.35.
Alternative strategy:
Above 82.95, target 83.35 then 83.75.
Technical analysis:
The RSI technical indicator is bearish, with further downside potential.
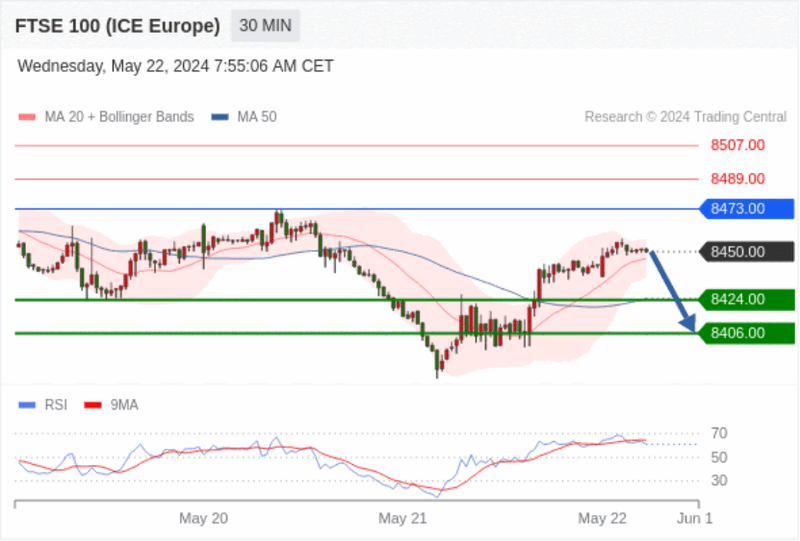
UK FTSE 100 Futures Intraday: Short-term adjustment.
Pivot point:
8473.00
Trading strategy:
Below 8473.00, target 8424.00 then 8406.00.
Alternative strategy:
Above 8473.00, target 8489.00 then 8507.00.
Technical analysis:
The RSI technical indicator shows a complex trend.