Explore today's market views from the Global Research Department at the Trading Center. Discover new trading methods and opportunities from popular trading products.
EUR/USD Gold Spot GBP/USD EUR/JPY EUR/GBP USD/CHF DAX Futures (Eurex) Brent Crude Oil (ICE) FTSE 100 Futures
Note: Due to market volatility, prices might have surpassed key points, causing strategy invalidation.
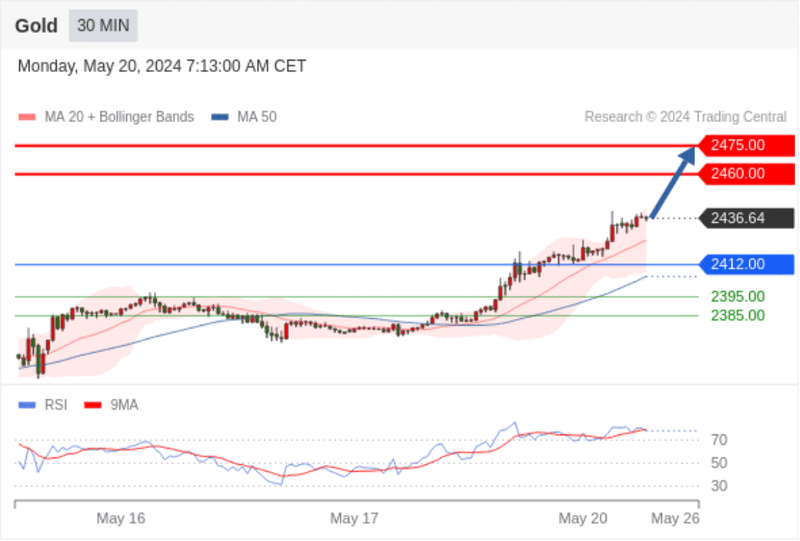
Gold Spot Intraday: Uptrend.
Pivot point:
2412.00
Trading strategy:
Above 2412.00, look for bullish targets at 2460.00 and then 2475.00.
Alternative strategy:
Below 2412.00, look for bearish targets at 2395.00 and then 2385.00.
Technical comment:
Subsequent resistance levels are 2460.00 and then 2475.00.
![363f96e204da4f6283540685c8dffa07384](https://production-app-asset.traderknows.com/images/1d194579838b464c94638f5e6674fa0a.width-800.png?Expires=1724651732&Signature=aotJc6TvNl2hMxdxCapI1J5Gn5RH7nh2ox4NmzpDyQCo0aO2BF8OZqP7LXAY~RH9srNnY27kbjYGTqiSpwwyS76Rb24yf2YtVF0klUYzTE5FWPhtrqbS105wEngh6eVNr6BdE~wHc5qWq1Yg2QthVO61J9T49jck7AdeY4xxVUYWYIvZtH1UctC1NQDJbx9LbLFAOMYJuUMebo25y1YFhKxiq1SJ6Lvoj8p2uP0w9pPgdbUkohIpMkZm9W6oCGY-oIN5b7OfykwXsFnqt4LwCt1xB~vFK2rtnaL5ECzLKf2rmo184Ok5Ev8DIx~dX39eMWWFVbvgAbypR615fmOD0g__&Key-Pair-Id=K3LHBTUA5A7KEY)
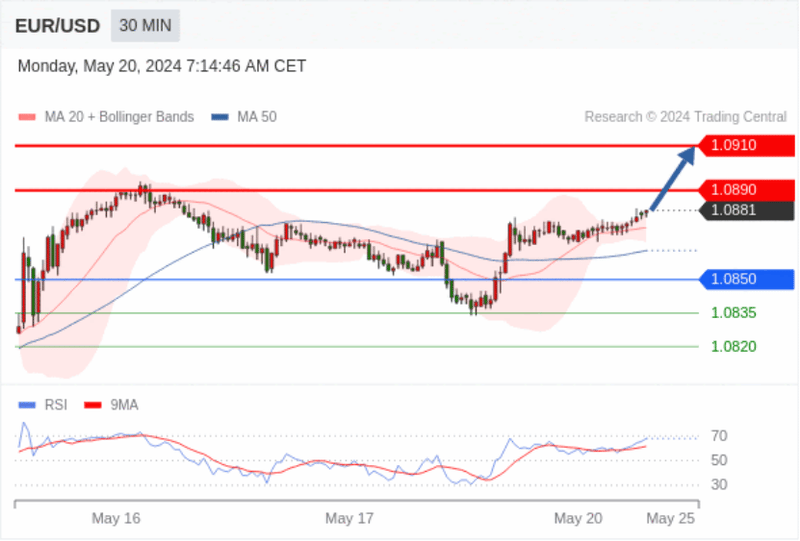
EUR/USD Intraday: Further upside.
Pivot point:
1.0850
Trading strategy:
Above 1.0850, look for bullish targets at 1.0890 and then 1.0910.
Alternative strategy:
Below 1.0850, look for bearish targets at 1.0835 and then 1.0820.
Technical comment:
The RSI technical indicator is trending upwards.
![363f96e204da4f6283540685c8dffa07554](https://production-app-asset.traderknows.com/images/a488dadae5da46fda4419e03cf2bfae7.width-800.png?Expires=1724651732&Signature=L1XFRDD8m4dsjAkk1l~amW3Z6vwGbQc-2dCGenJ-O-8TKZybpVVfzKyglnzhenU4lWdgGnghugKHtULKuRf7zYtx~R9HQpfG1KFcL7-biUf5IEcI8Ajlk3~qBT2HTlaRdRgiB2Y5zH5FNK2~ErwTRf2-HwqHrByfoVRCDrfYCK7~69TbGizaHbYHsfjobhdv1iJeYLGU6o4-3zx~Cu3wtjQxWZ4uOZPqaOsQSbQymq2wuPo6ZbQpX35OpIrCGKfOSPVQbM1V~9xX22KqcQ90njEuYQ63C5Fl8PNR3j0G8Zip1godTE5BQ~VIGxK98GKHRYVf3EwahpMXZRsD5mxvDQ__&Key-Pair-Id=K3LHBTUA5A7KEY)
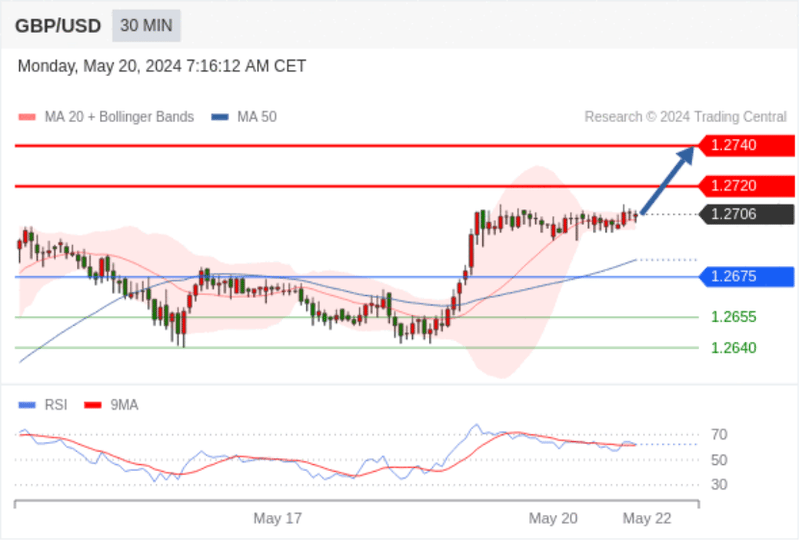
GBP/USD Intraday: Uptrend.
Pivot point:
1.2675
Trading strategy:
Above 1.2675, look for bullish targets at 1.2720 and then 1.2740.
Alternative strategy:
Below 1.2675, look for bearish targets at 1.2655 and then 1.2640.
Technical comment:
The RSI technical indicator is trending upwards.
![363f96e204da4f6283540685c8dffa07720](https://production-app-asset.traderknows.com/images/e7af8d4a23cd4131b1e981eae862fcc9.width-800.png?Expires=1724651732&Signature=XpKRDT2O~0hwk9WV0PIejOX-XXMMDaazsyxWNWDpzKs~M8p41ukmSEW3etOa0sZfTR5Pv9tfwlZ56FOdxidXNyRIv2zILKQT1K9vVFbnMDjwIJe9sTK7UTkAQ7QVDjx0CmFYZIqhBUVJjNEHAABiYtcvwPpBV1wnWAS3pOEc88cDWV1z4Flwr6k96pJhZy7tAjNRtvdi1~wGCppP7HtNsubn0hMAMKh-wUIzOSgej36BLfypn7dLUU2jBEm7YlEshESYAUudQznv4Ka1JiJ0KuTY4mWvgGXP0bQ4-GQ4qEsOEu2SgIyFEiDnmZBh-MBJSYIIJTqCmog6TXE6bzLncQ__&Key-Pair-Id=K3LHBTUA5A7KEY)
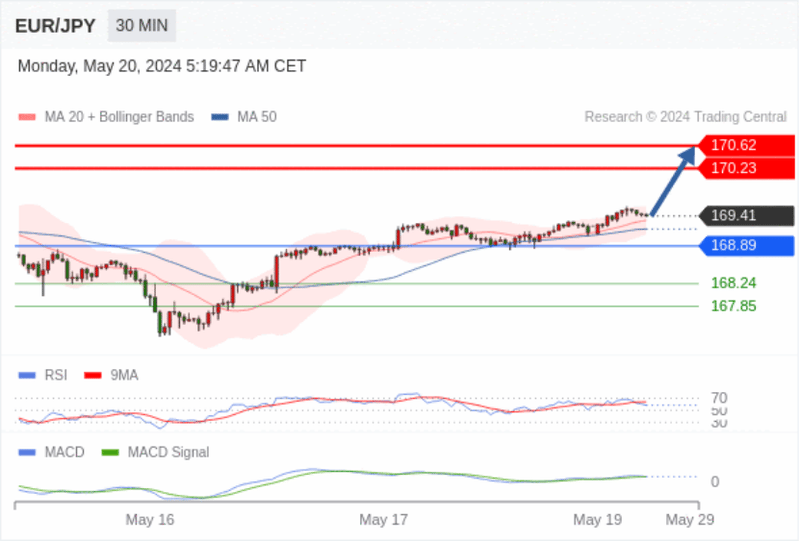
EUR/JPY Intraday: Bullish, support at 168.89.
Pivot point at:
168.89
Trading strategy:
Bullish as long as 168.89 is support.
Alternative strategy:
If below 168.89, EUR/JPY targets set at 168.24 and 167.85.
Technical comment:
RSI above 50. MACD above its signal line, bullish. Also, prices above the 20 and 50-day moving averages (169.33 and 169.18 respectively).
![363f96e204da4f6283540685c8dffa07947](https://production-app-asset.traderknows.com/images/745ae8655d474d29bffc2b2ec0f7e284.width-800.png?Expires=1724651732&Signature=lYX30RZux-kn2UzZnY3zdOTNXcx4CD4Q7lbosyDFHOXD9rrLg8HTT4Qnw0TLps8IctSn14Cx-clTscEMzpbEEEy~lO5OfbIU6YUm6YC77npCag~qhCi5aNQEc9tRSFTrGhZqaf5AYUSa45Lcg-0ccoQPC-k1dByEbOHIX7TR3-vM1oM3JsLnO4oPUn-0JS-BrSuW2iVeDqhfuCloUYs5KegGaohaTLBFcgc~sYbcObR0I0ax78vHXitbdzkFPjvals666vtZQqmtBFCThKbTlM9Y-sNjKRB2iuj9yw176b7KUk4EUUHpVY46trIxqflYVWi6CWGrO6eO78AVDJ1Avg__&Key-Pair-Id=K3LHBTUA5A7KEY)
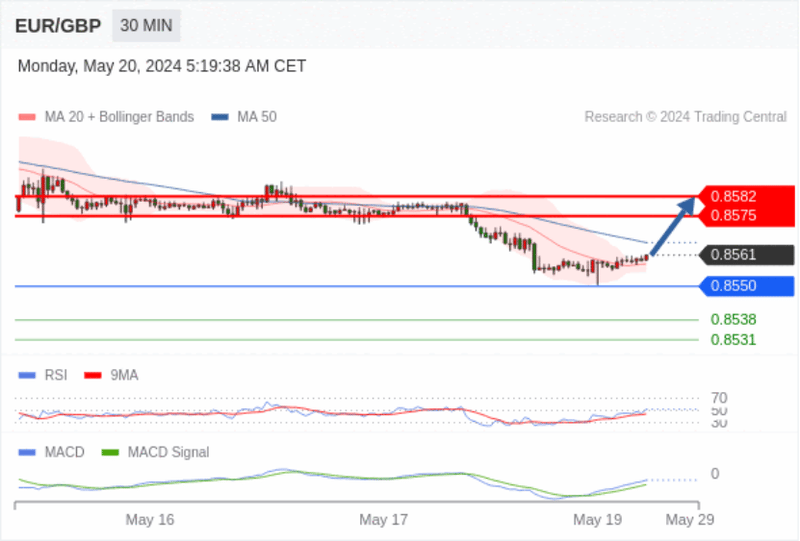
EUR/GBP Intraday: Bullish.
Pivot point at 0.8550.
Trading strategy:
Bullish.
Alternative strategy:
Below 0.8550, the downtrend may continue targeting 0.8538 and then 0.8531.
Technical comment:
RSI above 50. MACD above signal line, showing bullish momentum. Price below the 50-day MA (0.8566) but above the 20-day MA (0.8558).
![363f96e204da4f6283540685c8dffa071168](https://production-app-asset.traderknows.com/images/912d615955f3487b88168106af658e2c.width-800.png?Expires=1724651732&Signature=XRlNKy2iqLMEOH8r8zX5GOUY~Survqx-LWvjBNRSxbUG0aOLuPM7pN2EhBgoJCqXbbkYHmyZPdXFvCkvpRZ-0Tr8ZZdtFMDFZi~p-cgb24PoNF2otQGHIt7aYQNFu~XKCHPwLDbd1kzw3HSDfEFSOu4NhhRihffRhVXO5E2SpfX2DQjGT7giZGe1KHNWfMZrO0TF42SZ0Cu0ARCMbc742aZnSuJQEGzoFAUj9jy4hVpQHDoP-0eetiSxwsGVlLPhGVvnCY-Fji4BjI5kiad1MaXQdQ-WN37ce6siJTxtroSRQ1Orfi4~pJfoPaj8AU1aphihCSTiFAYPjPaaS4CH-g__&Key-Pair-Id=K3LHBTUA5A7KEY)
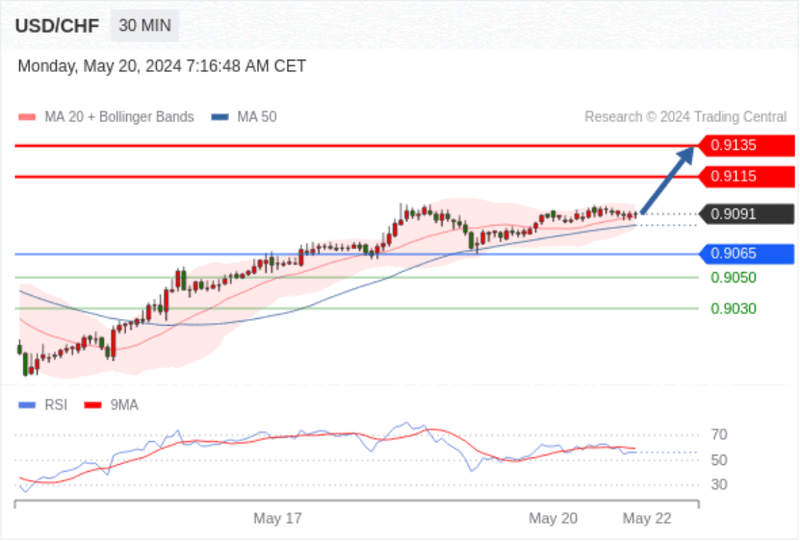
USD/CHF Intraday: Bullish.
Pivot point:
0.9065
Trading strategy:
Above 0.9065, look for bullish targets at 0.9115 and then 0.9135.
Alternative strategy:
Below 0.9065, look for bearish targets at 0.9050 and then 0.9030.
Technical comment:
Subsequent resistance levels are 0.9115 and then 0.9135.
![363f96e204da4f6283540685c8dffa071340](https://production-app-asset.traderknows.com/images/2bae5bf4e4c8445b94019c3a0ebcfef2.width-800.png?Expires=1724651732&Signature=UccL5ASeOXjcq5aAYXcXu5wyxB0wCuoH8ze8Xtr2v49noLfvWtAA9PMpfoD4j2RjjN3TdSVdtt3KkAD68yTIAokBZS9DIEeXKPhlDRFlWlL6p9g8GvOar6xlXdCLghy6wED9zadncMB6eZx83k8uy24GAT6JQA-mxlHRWtNtZEp0L-B8Y91XGj03y32OCDakedtq34Uo3P00XD-qmexc64qgCZnu20RNK8EqjBPxWHmqp1jGNP6YiKxrMn2PbYIWruzN5Rib4h0fhkQQQPXK1xmO5rhp4YOr9Bt~-rad1sBB~2HnonwhHgrJr52p5Tr5crh4i5TD4YMQeTqldMo1jQ__&Key-Pair-Id=K3LHBTUA5A7KEY)
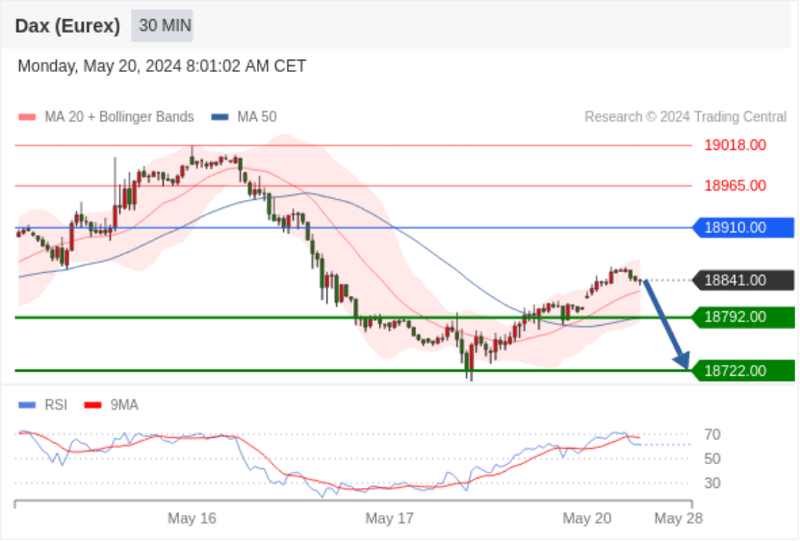
DAX Futures (Eurex) (M4) Intraday: Short-term adjustment.
Pivot point:
18910.00
Trading strategy:
Below 18910.00, look for bearish targets at 18792.00 and then 18722.00.
Alternative strategy:
Above 18910.00, look for bullish targets at 18965.00 and then 19018.00.
Technical comment:
RSI lacks momentum.
![363f96e204da4f6283540685c8dffa071540](https://production-app-asset.traderknows.com/images/0037769258564c58af5d1fa5204e21e2.width-800.png?Expires=1724651732&Signature=AV6QibTel37drdCdqfrOakqFB7SU3H5IF7hoyf3m0NOn2xJv-gSDpvS1aTnb0CPW2nSbbkSeJZ4p9RqrVuH0cP8XnrlYop4UDBLzZ41jL8F41b7MiSt3qFNxH0L~OpdyVlrIBlBXSrRuFWfk-~GWIw7Ky6dC0OqSvlL9lkmHB8mna0mjpM3iVbGcmSL9JDxM~ME82pmd1VuhXN-ZFDVl-tAU~Y4~ZqZ4xmiDGiR0HfAF5WJKOVp31avptU3r3kxgBYfy4dsPBzT3HmEBUuB5HF~58M2qGNk6Q3ElnV~FnOdyYTpogR2UsVLV~bzM-b2-JWhcly5i4G0Q0fqg7PjYZg__&Key-Pair-Id=K3LHBTUA5A7KEY)
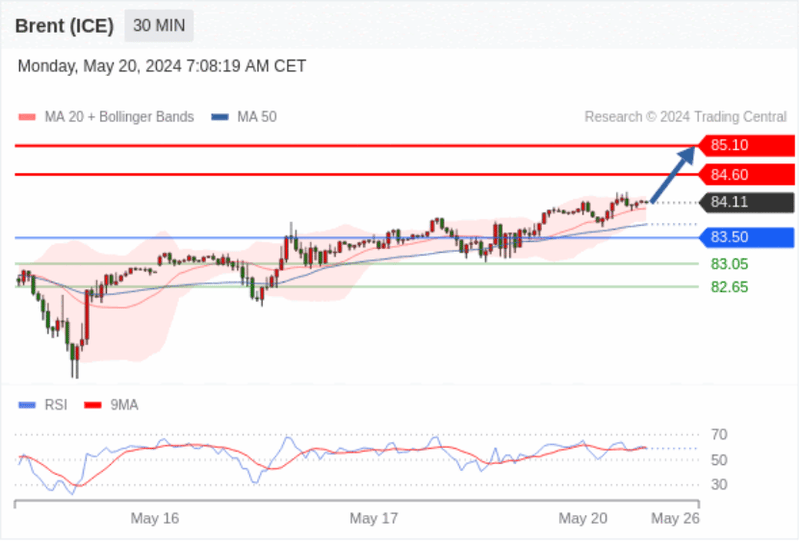
Brent Crude Oil (ICE) (N4) Intraday: Target at 84.60.
Pivot point:
83.50
Trading strategy:
Above 83.50, look for bullish targets at 84.60 and then 85.10.
Alternative strategy:
Below 83.50, look for bearish targets at 83.05 and then 82.65.
Technical comment:
RSI showing complex but upward trend.
![363f96e204da4f6283540685c8dffa071724](https://production-app-asset.traderknows.com/images/2dd711d91e3241c5af8f9ffa791a82e8.width-800.png?Expires=1724651732&Signature=CCoQjXs9Y~tVZc5HZ74tj5NrVFLguRo-mfd-2k-d8eIhrZZ22VCTLMhuHivXxfp0SuC8G~AAIurR0T6D2DDvR7P3p64PMczhqXX8YmUks-4UYNL0WKNsbbIt0iYPIPs-~~yhjSZwiM4-la03dnj-lSqcdpCnHo3UGgbomD0W435DOY5JJk2vWxRWYmds-LlKsIiGjlwBo8uP65XOjasYUJuw2tixVEWuC68R2amSicd0B-b5L4a9vVIcwoXhW~UOqSRu554RmNLC0Darp4wCl6RAuA01vCsQucUrn3aGiUBmtfAS0YceHzzCyzi8K6SuF0IQocdSigYShajXkPrijw__&Key-Pair-Id=K3LHBTUA5A7KEY)
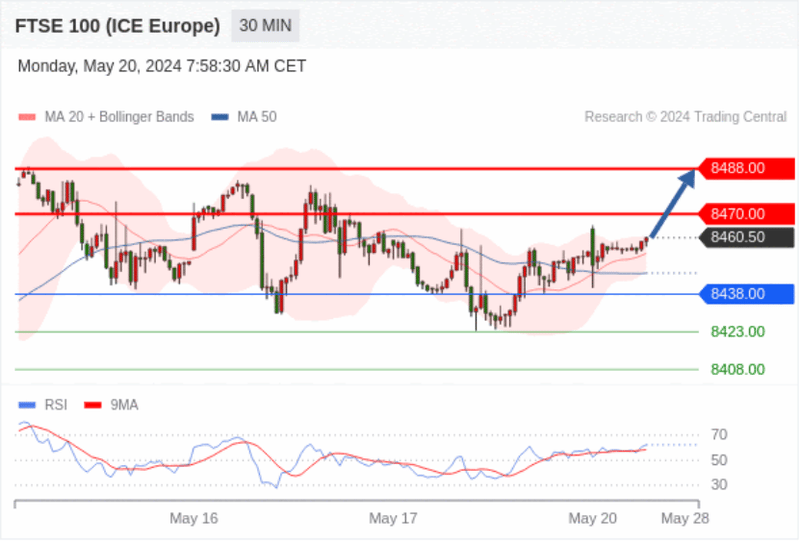
FTSE 100 Futures Intraday: Near-term support around 8438.00.
Pivot point:
8438.00
Trading strategy:
Above 8438.00, look for bullish targets at 8470.00 and then 8488.00.
Alternative strategy:
Below 8438.00, look for bearish targets at 8423.00 and then 8408.00.
Technical comment:
RSI showing complex but upward trend.
![363f96e204da4f6283540685c8dffa071921](https://production-app-asset.traderknows.com/images/8abab63ad0c4431faff6ed1b1e562326.width-800.png?Expires=1724651732&Signature=rpDwSst4Xa5-TZkgoeoshg18ffggoqp9pv2IDkDdyU25YB2yPuTgq2DEQMgnJvWpexzmfy754USE3698fbRwcyan2vPwhlRPsEzo78mG1v~~gXNydyDjK8K93rgH55d86DoaUIbzKhVjYaDWeCxI-Zr0HU7jsGRjt7k5XQJgmRsyhYJCfgM4f0Y7n-Fuh2vrwzkND-FRayHm5NZRCpvRWzrUOSAvuLyNbO1s9EliF6omtId0VfSt1sqdU6X8pdkW1gB-zChOo-EDPMNFp3H1Yl~V3d49xPxG898WqfDb-L2CDQKRmPUyXSDV1KOsISOcp9vqcr9NyP990p3-esUD0Q__&Key-Pair-Id=K3LHBTUA5A7KEY)