Check out today's market perspectives from the Global Research Department at the Trading Center. Explore new trading methods and opportunities from popular trading products.
Euro/US Dollar British Pound/US Dollar Spot Gold Euro/Japanese Yen Euro/British Pound US Dollar/Swiss Franc German DAX Index Futures (Eurex) Brent Crude (ICE) UK FTSE 100 Index Futures
Kind reminder: Due to market volatility, prices may have crossed key points, making strategies ineffective.
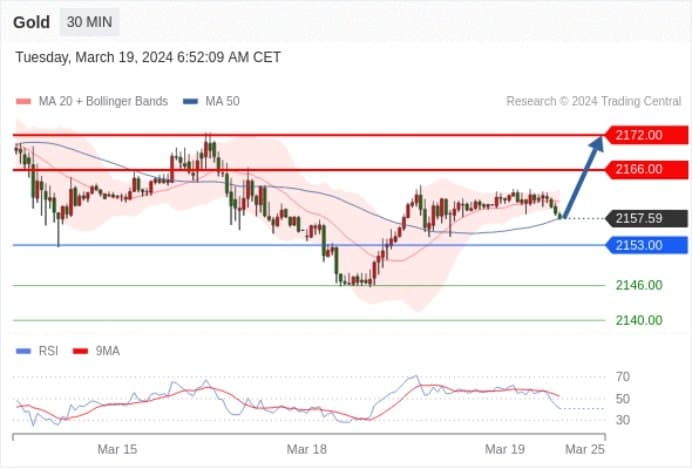
Spot Gold Within the day: Bullish above 2153.00.
Pivot Point:
2153.00
Trading strategy:
Above 2153.00, bullish with target prices at 2166.00 and then 2172.00.
Alternative strategy:
Below 2153.00, bearish with target prices at 2146.00 and then 2140.00.
Technical comment:
Even though we cannot rule out the possibility of ongoing adjustments, they should be limited in duration.
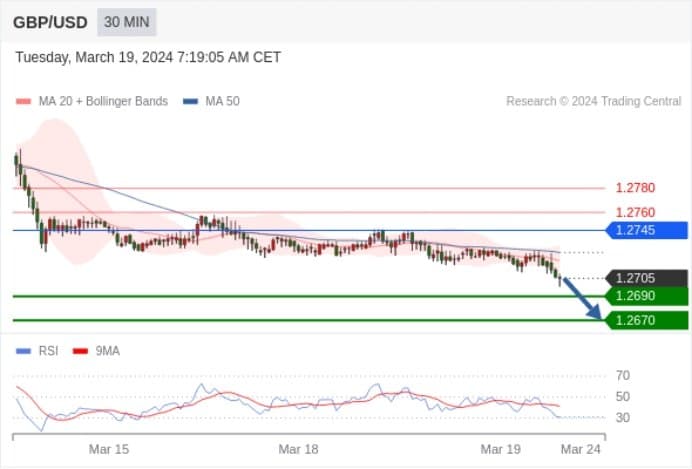
British Pound/US Dollar Within the day: Downward trend.
Pivot Point:
1.2745
Trading strategy:
Below 1.2745, bearish with target prices at 1.2690 and then 1.2670.
Alternative strategy:
Above 1.2745, bullish with target prices at 1.2760 and then 1.2780.
Technical comment:
RSI indicator is moving downwards.
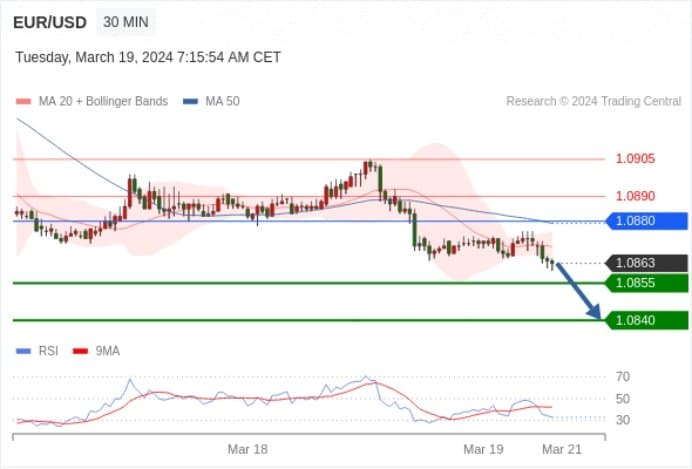
Euro/US Dollar Within the day: Under pressure.
Pivot Point:
1.0880
Trading strategy:
Below 1.0880, bearish with target prices at 1.0855 and then 1.0840.
Alternative strategy:
Above 1.0880, bullish with target prices at 1.0890 and then 1.0905.
Technical comment:
A break below 1.0855 would trigger a drop to 1.0840.
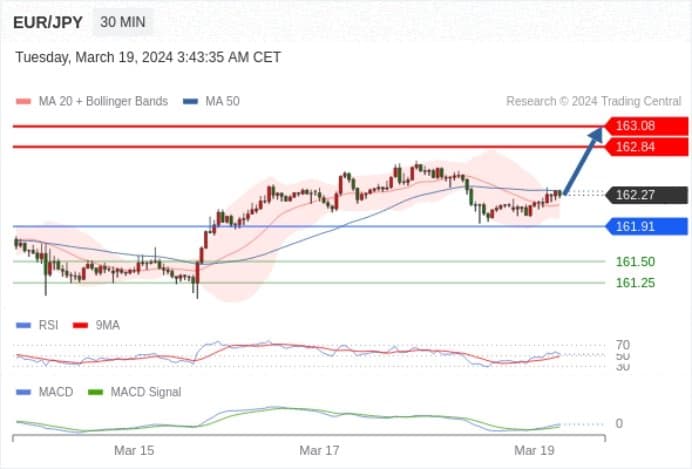
Euro/Japanese Yen Within the day: Bullish.
Pivot point: 161.91.
Trading strategy:
Bullish.
Alternative strategy:
A downward break of 161.91 would lead to a continuing decline, with target prices at 161.50 and then 161.25.
Technical comment:
RSI indicator is above 50. MACD indicator is bearish but above its signal line. Additionally, the price is below its 50-day moving average (162.32) but above its 20-day moving average (162.16).
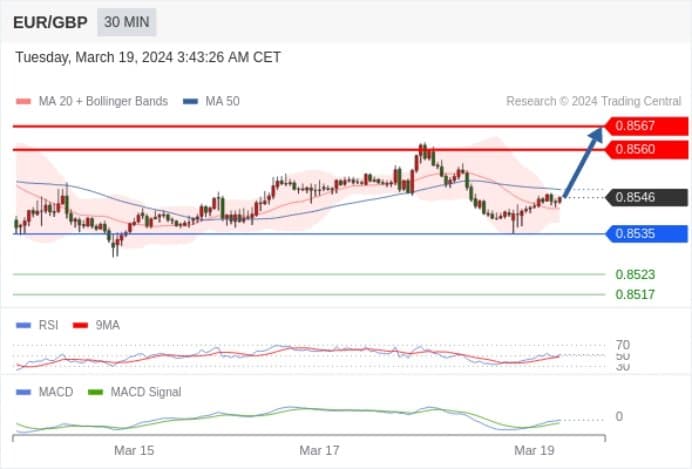
Euro/British Pound Within the day: Bullish.
Pivot point: 0.8535.
Trading strategy:
Bullish.
Alternative strategy:
If it falls below 0.8535, the target direction for EUR/GBP is set at 0.8523 and then 0.8517.
Technical comment:
RSI indicator is above 50. MACD indicator is bearish but above its signal line. Additionally, the price is below its 50-day moving average (0.8548) but above its 20-day moving average (0.8543).
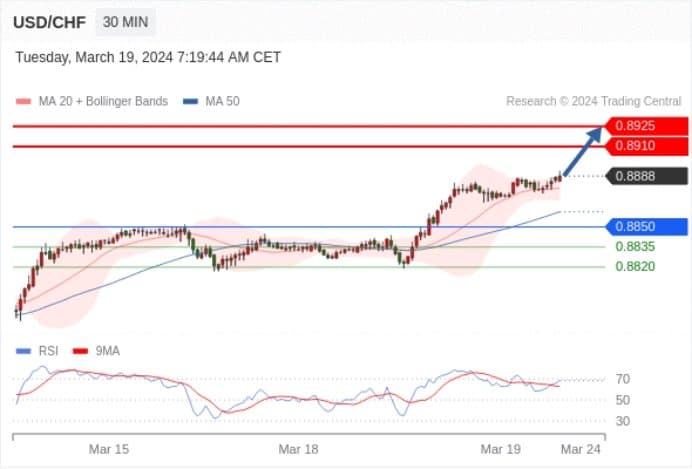
US Dollar/Swiss Franc Within the day: A new round of ascent.
Pivot Point:
0.8850
Trading strategy:
Above 0.8850, bullish with target prices at 0.8910 and then 0.8925.
Alternative strategy:
Below 0.8850, bearish with target prices at 0.8835 and then 0.8820.
Technical comment:
RSI indicator is moving upwards.
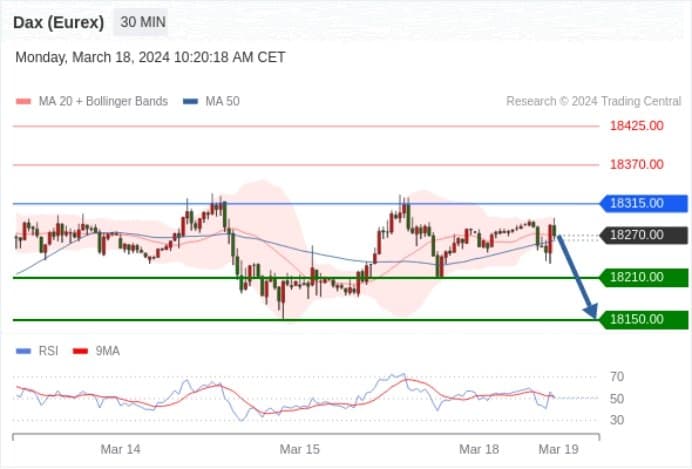
German DAX Index Futures (Eurex) (M4) Within the day: Short-term adjustment.
Pivot Point:
18315.00
Trading strategy:
Below 18315.00, bearish with target prices at 18210.00 and then 18150.00.
Alternative strategy:
Above 18315.00, bullish with target prices at 18370.00 and then 18425.00.
Technical comment:
As long as there is resistance at 18315.00, there is a bearish trend in price fluctuations.
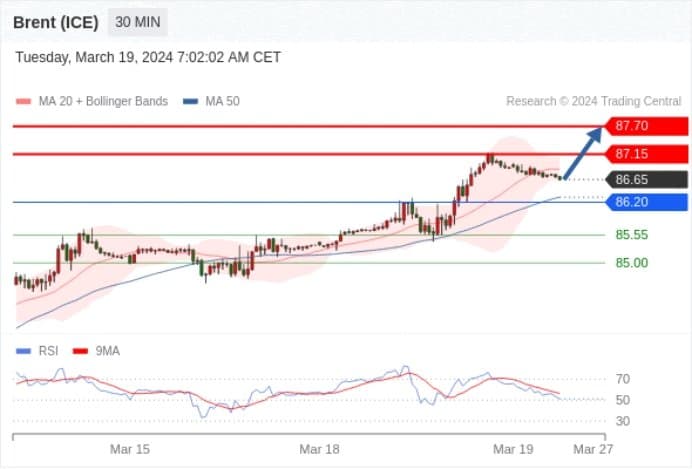
Brent Crude (ICE) (K4) Within the day: Bullish.
Pivot Point:
86.20
Trading strategy:
Above 86.20, bullish with target prices at 87.15 and then 87.70.
Alternative strategy:
Below 86.20, bearish with target prices at 85.55 and then 85.00.
Technical comment:
Even though we cannot rule out the possibility of ongoing adjustments, they should be limited in duration.
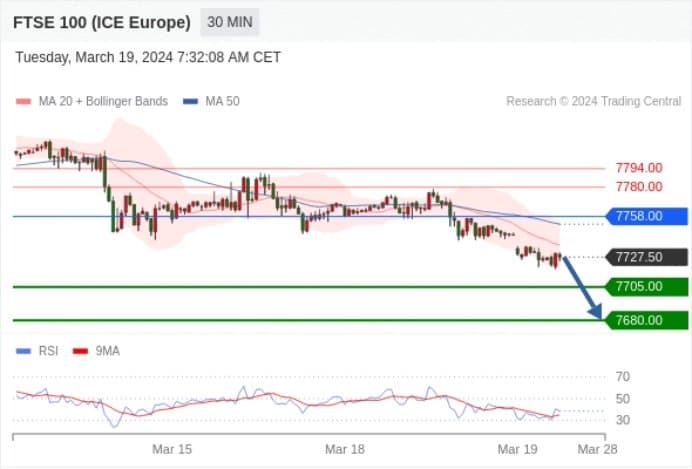
UK FTSE 100 Index Futures Within the day: Under pressure.
Pivot Point:
7758.00
Trading strategy:
Below 7758.00, bearish with target prices at 7705.00 and then 7680.00.
Alternative strategy:
Above 7758.00, bullish with target prices at 7780.00 and then 7794.00.
Technical comment:
RSI indicator is below the 50% neutral zone.