Check out today's market insights from the Global Research Department at the Trading Center. Discover new trading methods and opportunities from popular trading products.
EUR/USD Spot Gold GBP/USD EUR/JPY EUR/GBP USD/CHF German DAX Futures (Eurex) Brent Crude Oil (ICE) UK FTSE 100 Futures
Attention: Due to market fluctuations, prices may have crossed key levels, making the strategies invalid.
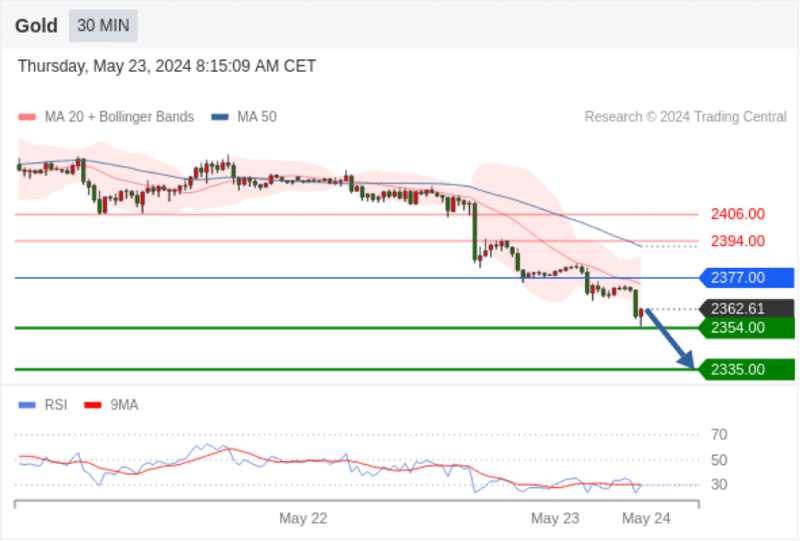
Spot Gold Intraday: Under Pressure.
Pivot Point:
2377.00
Trading Strategy:
Below 2377.00, bearish with target prices at 2354.00 and then 2335.00.
Alternative Strategy:
Above 2377.00, bullish with target prices set at 2394.00 and then 2406.00.
Technical Commentary:
Breaking below 2354.00 will trigger a drop to 2335.00.
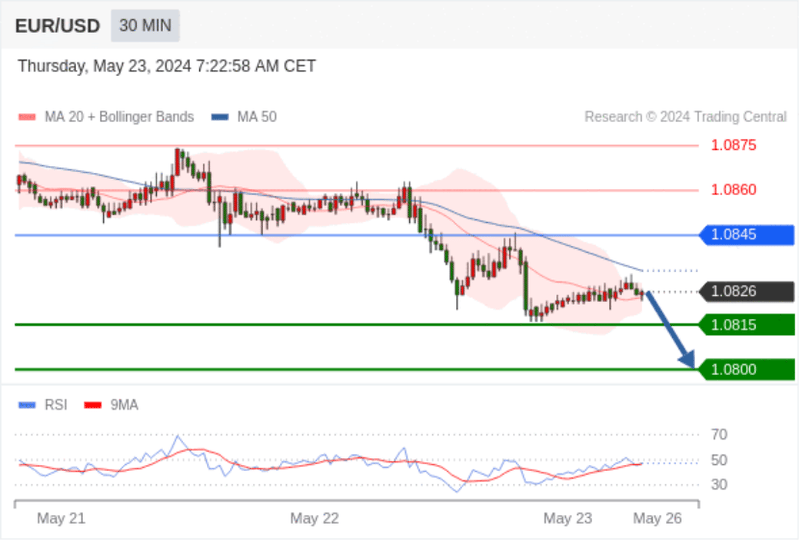
EUR/USD Intraday: Downtrend.
Pivot Point:
1.0845
Trading Strategy:
Below 1.0845, bearish with target prices at 1.0815 and then 1.0800.
Alternative Strategy:
Above 1.0845, bullish with target prices set at 1.0860 and then 1.0875.
Technical Commentary:
The RSI technical indicator shows a complex trend, leaning towards a downside.
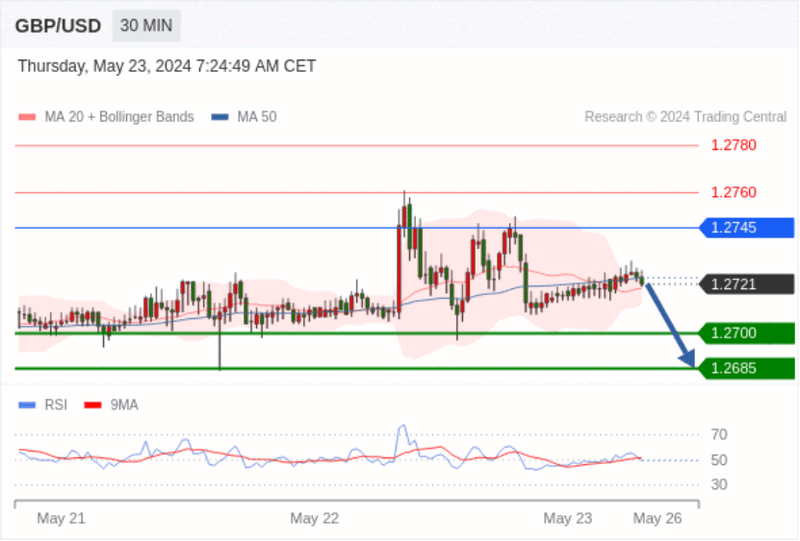
GBP/USD Intraday: Correction.
Pivot Point:
1.2745
Trading Strategy:
Below 1.2745, bearish with target prices at 1.2700 and then 1.2685.
Alternative Strategy:
Above 1.2745, bullish with target prices set at 1.2760 and then 1.2780.
Technical Commentary:
As long as resistance at 1.2745 holds, price movements are inclined to be bearish.
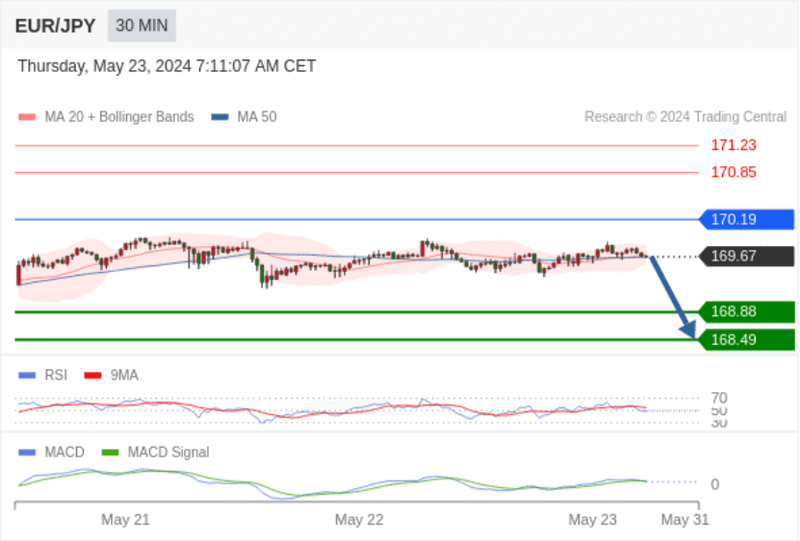
EUR/JPY Intraday: Gradually Down, with 168.49 as the Target if 170.19 Limits the Upside.
Pivot Point: 170.19
Trading Strategy:
Gradually down, with 168.49 as the target if 170.19 limits the upside.
Alternative Strategy:
If breaking 170.19, EUR/JPY targets 170.85 and 171.23.
Technical Commentary:
The RSI technical indicator is below 50. The MACD indicator shows a bullish state but is below its signal line. Additionally, the price is below its 20-day moving average (169.69) but above its 50-day moving average (169.65).
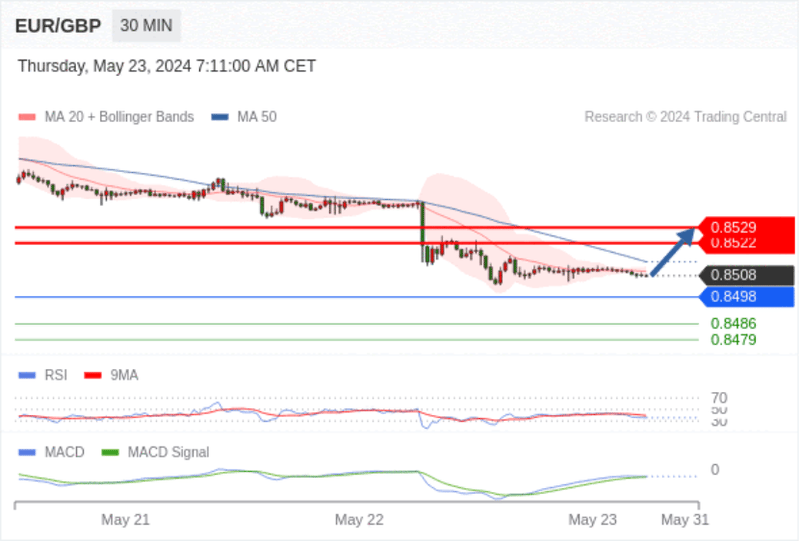
EUR/GBP Intraday: Potential Uptrend, Target Price Set at 0.8529.
Pivot Point: 0.8498
Trading Strategy:
Potential uptrend, target price set at 0.8529.
Alternative Strategy:
A break below 0.8498 will lead to a continued downtrend, targeting 0.8486 and then 0.8479.
Technical Commentary:
The RSI technical indicator is below the neutral area of 50. The MACD indicator is above its signal line and bearish. Moreover, the price is below its 20-day and 50-day moving averages (at 0.8509 and 0.8514, respectively).
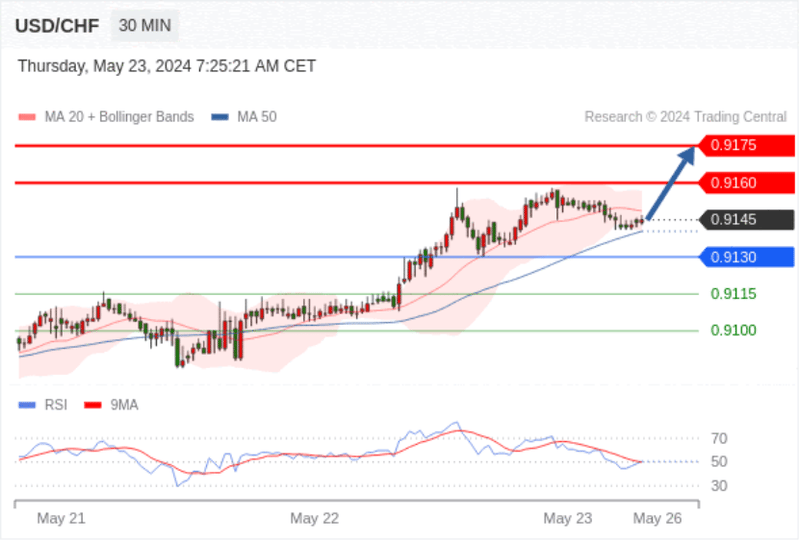
USD/CHF Intraday: Bullish Above 0.9130.
Pivot Point:
0.9130
Trading Strategy:
Above 0.9130, bullish with target prices at 0.9160 and then 0.9175.
Alternative Strategy:
Below 0.9130, bearish with target prices set at 0.9115 and then 0.9100.
Technical Commentary:
Even though we cannot rule out the possibility of further adjustments, the duration should be limited.
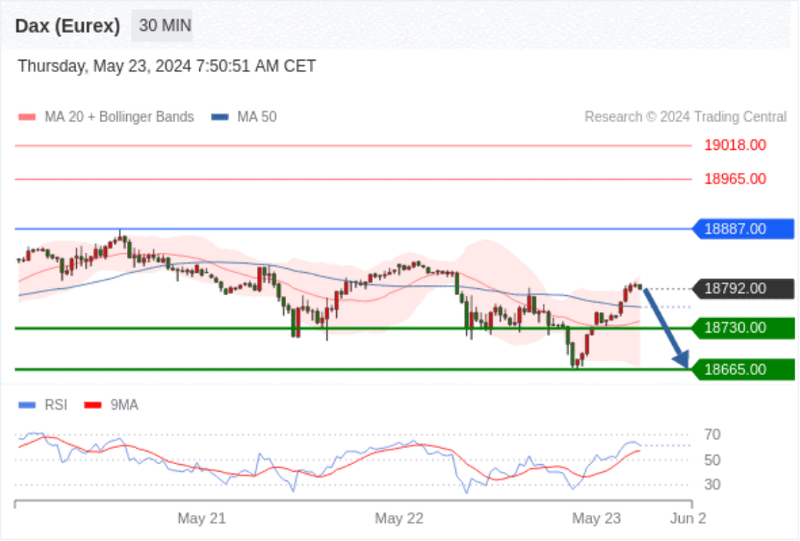
German DAX Futures (Eurex) Intraday: Short-Term Key Resistance at 18887.00.
Pivot Point:
18887.00
Trading Strategy:
Below 18887.00, bearish with target prices at 18730.00 and then 18665.00.
Alternative Strategy:
Above 18887.00, bullish with target prices set at 18965.00 and then 19018.00.
Technical Commentary:
As long as resistance at 18887.00 holds, price movements are inclined to be bearish.
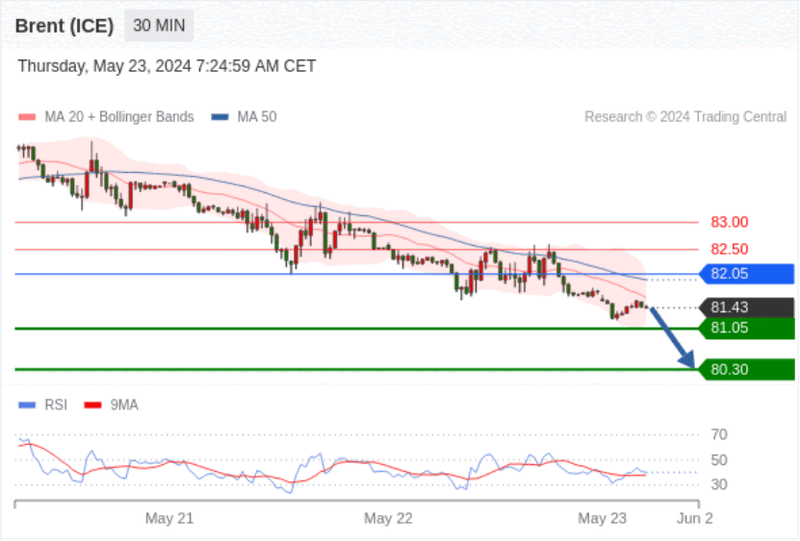
Brent Crude Oil (ICE) Intraday: Downtrend.
Pivot Point:
82.05
Trading Strategy:
Below 82.05, bearish with target prices at 81.05 and then 80.30.
Alternative Strategy:
Above 82.05, bullish with target prices set at 82.50 and then 83.00.
Technical Commentary:
The RSI technical indicator is trending downwards.
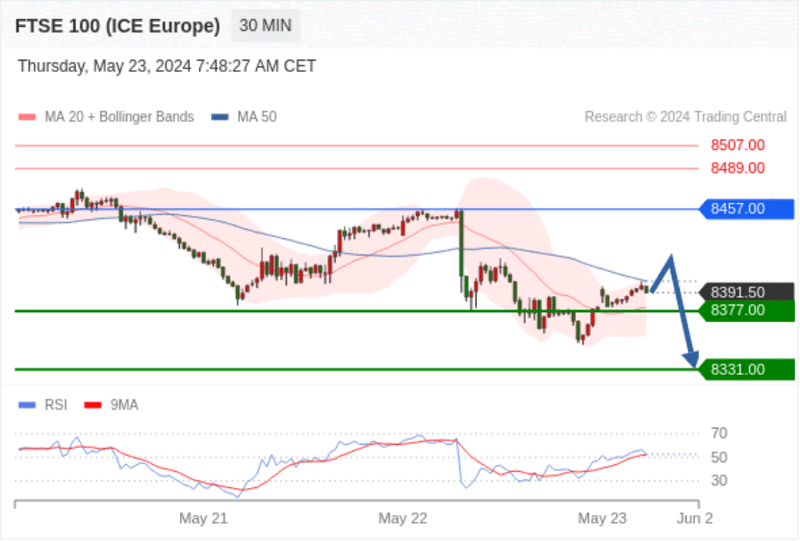
UK FTSE 100 Futures Intraday: Short-Term Key Resistance at 8457.00.
Pivot Point:
8457.00
Trading Strategy:
Below 8457.00, bearish with target prices at 8377.00 and then 8331.00.
Alternative Strategy:
Above 8457.00, bullish with target prices set at 8489.00 and then 8507.00.
Technical Commentary:
As long as resistance at 8457.00 holds, price movements are inclined to be bearish.