What is a Hammerhead Line
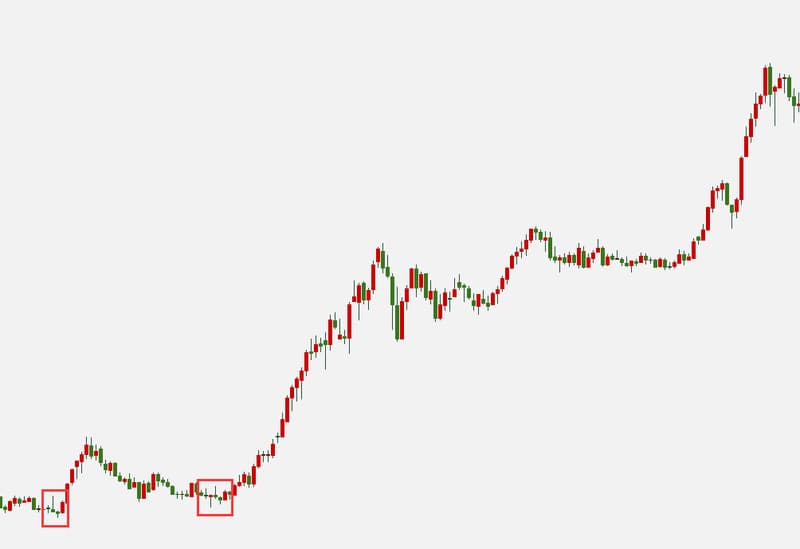
A hammerhead line is a candlestick pattern that typically appears at the bottom of a downtrend, characterized by a small body and a long lower shadow. This candlestick pattern is common in the stock market, forex, and other financial markets and is generally considered a signal of a price bottoming out or a trend reversal.
Characteristics of Hammerhead Line
As one of the common patterns indicating a price or trend reversal, the hammerhead line has the following characteristics:
- Shape: Composed of a small body and a long lower shadow, with the body located at the top, and the lower shadow extending downward to the lowest point.
- Shadow: The upper shadow is short or non-existent, while the lower shadow is long.
- Location: Typically appears at the bottom or end of a downtrend.
- Reversal Signal: Indicates the possibility of a price or trend bottoming out or reversing.
- Support Level: The low point of the lower shadow usually has a significant support level.
Usage of Hammerhead Line
The hammerhead line is a pattern frequently used by investors during trading and serves various purposes:
- Reversal Signal: Usually appears in a downtrend, implying the possibility of a price or trend reversal.
- Support Level: The low point of the lower shadow is generally an important support level during a trading period.
- Verification: If a hammerhead line appears and the price remains sluggish without making a new low, it suggests an increased possibility of a market bottoming out or trend reversal.
- Combining with Other Indicators: When other technical analysis tools or indicators show signs of bottoming out or a reversal, the appearance of a hammerhead line further strengthens the possibility of a bottoming out or reversal.
Differences Between Hammerhead Line and Hanging Man Line
Although the hammerhead line and hanging man line have similar appearances, there are significant differences in their meanings and usages:
- The hammerhead line appears in a downtrend, while the hanging man line appears in an uptrend.
- The hammerhead line indicates a possible market bottom, whereas the hanging man line indicates a possible market top.
- The bullish hammerhead line has stronger bullish implications, while the bearish hanging man line has stronger bearish implications.