What is an Umbrella Line Pattern?
The Umbrella Line Pattern is a candlestick pattern that typically appears at the top or bottom of a market, signaling a potential reversal or adjustment in the price trend. The Umbrella Line Pattern has the following features.
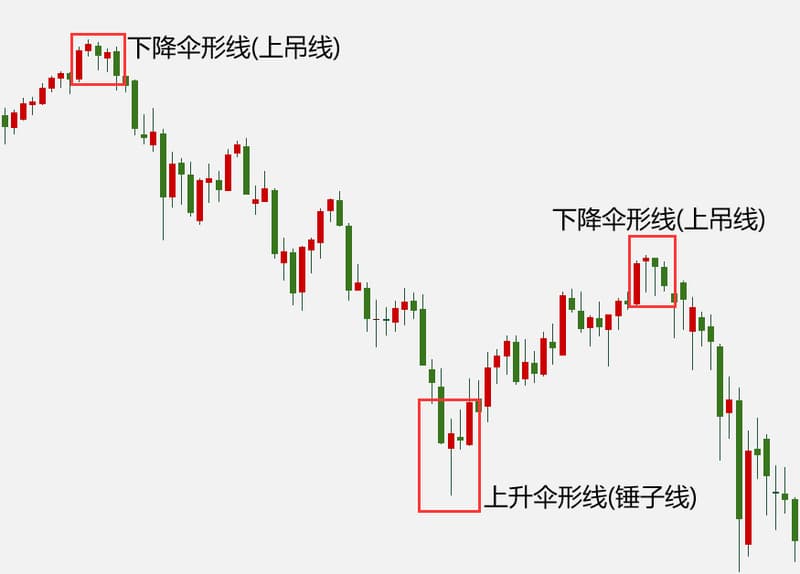
- Small body: The Umbrella Line usually has a small body, indicating short-term price fluctuations in the market.
- Long lower shadow: The Umbrella Line features a long lower shadow extending below the body.
- Small upper shadow: The Umbrella Line has a small or negligible upper shadow.
However, a standalone Umbrella Line Pattern is not necessarily a reliable signal. It should be confirmed with other technical indicators and price patterns to identify market turning points. For instance, if the Umbrella Line Pattern appears near a significant support level or other technical indicators show a buy signal, it might increase the reliability of the reversal or rebound signal.
Types of Umbrella Line Patterns
The Umbrella Line Pattern is generally divided into two types:
Inverted Hammer: The Inverted Hammer appears at the bottom of a market, indicating a potential reversal or rebound and has the following characteristics.
- Small body, typically green or red.
- Long upper shadow extending above the body, usually twice the length of the body or more.
- Small or non-existent lower shadow.
The Inverted Hammer suggests buying activity at the market bottom, indicating that selling pressure is weakening and buyers might be entering the market, causing the price to rebound. However, like the Umbrella Line Pattern, an Inverted Hammer alone isn't a definitive signal and should be confirmed with other technical indicators and price patterns.
Shooting Star: The Shooting Star appears at the top of a market, suggesting a potential reversal or downtrend signal and has the following characteristics.
- Small body, typically green or red.
- Long upper shadow extending above the body, usually twice the length of the body or more.
- Small or non-existent lower shadow.
The Shooting Star indicates increased selling pressure at the market top, suggesting weakening buying strength and a potential price decline. However, similar to the Inverted Hammer, a standalone Shooting Star is not necessarily a reliable signal and should be confirmed with other analytical tools.
Uses of Umbrella Line Patterns
Umbrella Line Patterns have certain applications in technical analysis, including the following common uses.
- Reversal signal: The appearance of an Umbrella Line Pattern is often seen as a potential reversal signal. When an Inverted Hammer appears at the market bottom or a Shooting Star appears at the market top, it may indicate a possible market reversal. Traders can use this as a signal to identify market bottoms or tops.
- Rebound signal: Umbrella Line Patterns can also signal a potential rebound in the market. When an Inverted Hammer appears near support levels in a downward trend or a Shooting Star appears near resistance levels in an upward trend, it may indicate a possible market rebound.
- Confirming other indicators and patterns: Umbrella Line Patterns can be used to confirm other technical indicators and price patterns. For instance, when an Umbrella Line Pattern appears near support levels and resonates with other support indicators (such as trend lines or support levels), it can increase the reliability of the reversal signal.
- Stop-loss and take-profit points: Traders can use Umbrella Line Patterns to determine stop-loss and take-profit points. For example, in a long trade, if the price drops and forms an Inverted Hammer, traders can set the stop-loss below the Umbrella Line while setting the take-profit at the anticipated rebound height.