What is the Tri Star Pattern?
The Tri Star Pattern is a type of price chart pattern that usually appears at the top or bottom of a price trend, indicating a possible trend reversal. It consists of three consecutive daily candlesticks, each with a relatively small price range, forming a narrowing price interval.
In an uptrend, the Tri Star Pattern typically appears at the top, suggesting that prices may start to decline. In a downtrend, it usually appears at the bottom, indicating that prices may start to rise.
The characteristic feature of the Tri Star Pattern is that the price range of the second day is entirely within the price range of the first day, and the price range of the third day is entirely within the price range of the second day. This pattern indicates increasing market uncertainty, with a shifting balance between buyers and sellers, potentially triggering a price reversal.
Features of the Tri Star Pattern
The features of the Tri Star Pattern are as follows:
- Three-day pattern: The Tri Star Pattern consists of three consecutive trading days, each with a relatively small price range.
- Narrowing price range: Each day's price range is entirely within the previous day's price range, forming an increasingly narrower price range.
- Increased market uncertainty: The appearance of the Tri Star Pattern indicates a shift in the balance of power between buyers and sellers, increasing market uncertainty.
- Possible trend reversal: In an uptrend, the Tri Star Pattern typically appears at the top, suggesting prices may start to fall; in a downtrend, it usually appears at the bottom, indicating prices may start to rise.
- Cautious trend confirmation: The Tri Star Pattern is not an absolute trend reversal signal and should be confirmed with other technical indicators and analysis methods.
- High attention: Due to its unique characteristics, the Tri Star Pattern often draws significant attention from traders and technical analysts and is considered a potential key price signal.
Types of Tri Star Patterns
The Tri Star Pattern can be classified into the following types based on its characteristics and occurrence position:
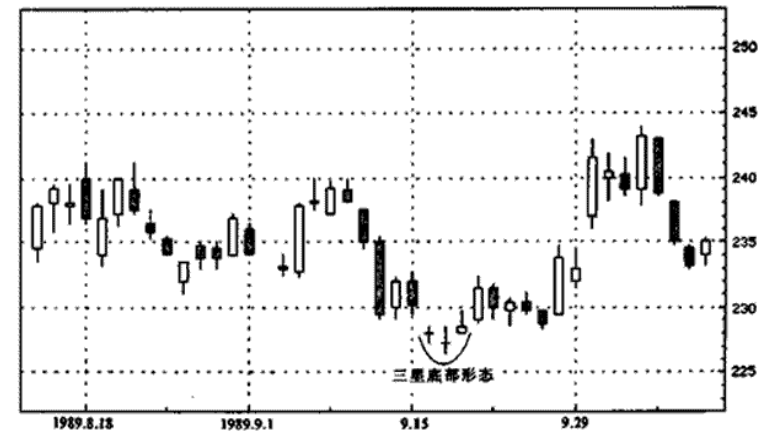
Bullish Tri Star Pattern (also called Tri Star Bottom): This pattern usually appears in a downtrend, indicating that prices may start to rise. It comprises three consecutive daily candlesticks, each with a narrowing price range, forming three nested small bullish candlesticks or small bodies.
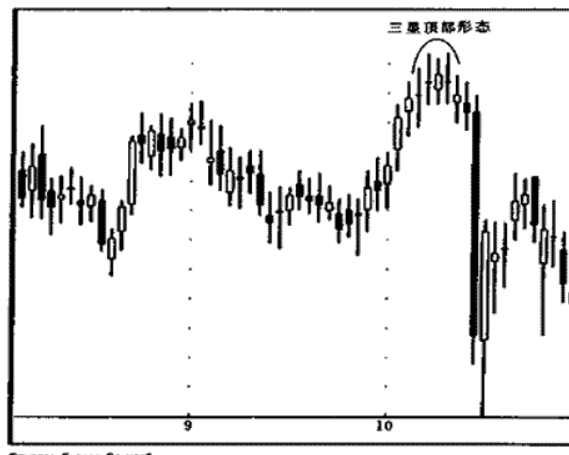
Bearish Tri Star Pattern (also called Tri Star Top): This pattern typically appears in an uptrend, suggesting that prices may start to fall. It also consists of three consecutive daily candlesticks, each with a narrowing price range, forming three nested small bearish candlesticks or small bodies.
Uncertain Tri Star Pattern: This pattern appears during the process of rising or falling prices, indicating increased market uncertainty. It consists of three consecutive daily candlesticks, each with a narrowing price range but without a clear trend direction.
Usage of the Tri Star Pattern
The Tri Star Pattern is a price pattern used mainly for technical analysis and price forecasting. Here are some common uses of the Tri Star Pattern:
- Trend reversal signal: When a Bullish Tri Star Pattern appears in a downtrend or a Bearish Tri Star Pattern appears in an uptrend, it may indicate a trend reversal. Traders can use this signal to identify reversal points and consider reversal trades.
- Trend change signal: The appearance of an Uncertain Tri Star Pattern often indicates increased market uncertainty and may suggest that prices are likely to change direction. Traders can monitor the market for further confirmation and adjust their trading strategies accordingly.
- Confirm other indicators: The Tri Star Pattern can be used as a confirmation signal for other technical indicators. For example, when a Bullish Tri Star Pattern appears, pairing it with other indicators like moving averages or the Relative Strength Index can enhance the accuracy of trading decisions.
- Set stop-loss levels: Traders can use the Tri Star Pattern to set stop-loss levels. For instance, in an uptrend, when a Bearish Tri Star Pattern appears, it may be a sell signal, and traders can set stop-loss levels at the high point of the pattern to protect profits or reduce losses.