Explore new trading methods and opportunities among popular trading products in today's market outlook from the Global Research Department of the Trading Center.
EUR/USD GBP/USD Spot Gold EUR/JPY EUR/GBP USD/CHF Germany DAX Index Futures (Eurex) Brent Crude (ICE) FTSE 100 Index Futures
Friendly Reminder: Due to market fluctuations, prices may have moved past key points, rendering strategies ineffective.
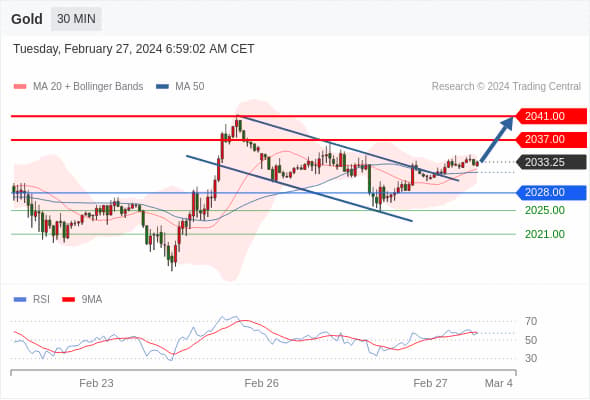
Spot Gold Today: Rising.
- Pivot Point:
2028.00
- Trading Strategy:
Above 2028.00, bullish, with target prices at 2037.00 and then 2041.00.
- Alternative Strategy:
Below 2028.00, bearish, with target prices set at 2025.00 and then 2021.00.
- Technical Commentary:
RSI technical indicator is above the 50% neutral zone.
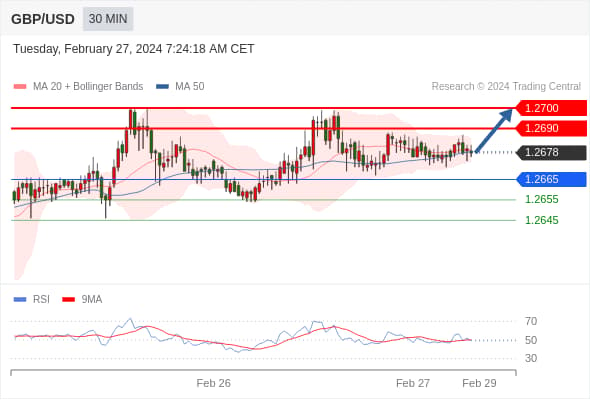
GBP/USD Today: Bullish above 1.2665.
- Pivot Point:
1.2665
- Trading Strategy:
Above 1.2665, bullish, with target prices at 1.2690 and then 1.2700.
- Alternative Strategy:
Below 1.2665, bearish, with target prices set at 1.2655 and then 1.2645.
- Technical Commentary:
A support base around 1.2665 brings short-term stability to the trend.
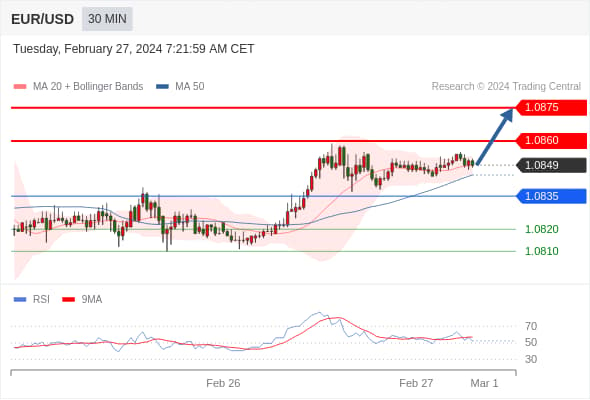
EUR/USD Today: Rising trend.
- Pivot Point:
1.0835
- Trading Strategy:
Above 1.0835, bullish, with target prices at 1.0860 and then 1.0875.
- Alternative Strategy:
Below 1.0835, bearish, with target prices set at 1.0820 and then 1.0810.
- Technical Commentary:
The trend of the RSI technical indicator is complex, leaning towards an upward movement.
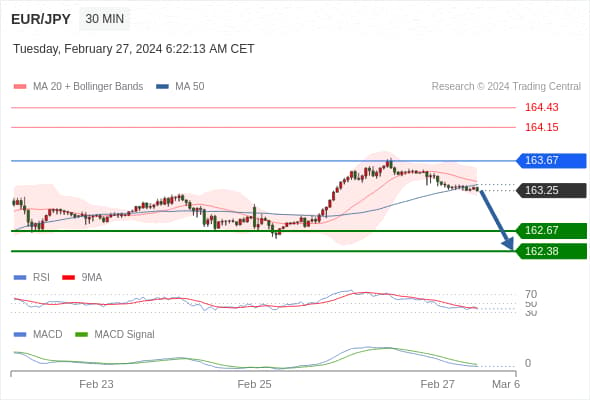
EUR/JPY Today: Bearish below 163.67.
- Pivot Point
163.67 as pivot point.
- Trading Strategy:
Bearish, below 163.67.
- Alternative Strategy:
If it breaks through 163.67, EUR/JPY targets direction are 164.15 and 164.43.
- Technical Commentary :
RSI technical indicator is below 50. MACD technical indicator is in a bearish state and below its signal line. Moreover, the price is below its 20-day and 50-day moving averages (currently at 163.37 and 163.33).
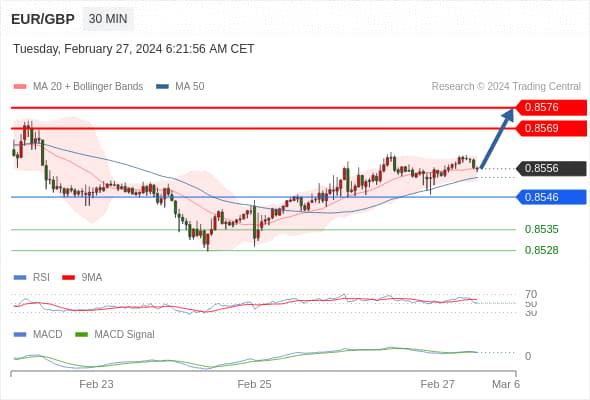
EUR/GBP Today: Bullish, with 0.8546 as support, targeting 0.8576.
- Pivot Point:
0.8546
- Trading Strategy:
Bullish, with 0.8546 as support, targeting 0.8576.
- Alternative Strategy:
If it falls below 0.8546, EUR/GBP target direction is set at 0.8535 and 0.8528.
- Technical Commentary :
RSI technical indicator is greater than the neutral zone of 50. MACD technical indicator is in a bullish state and below its signal line. Additionally, the price is above its 20-day and 50-day moving averages (located at 0.8555 and 0.8553 respectively).
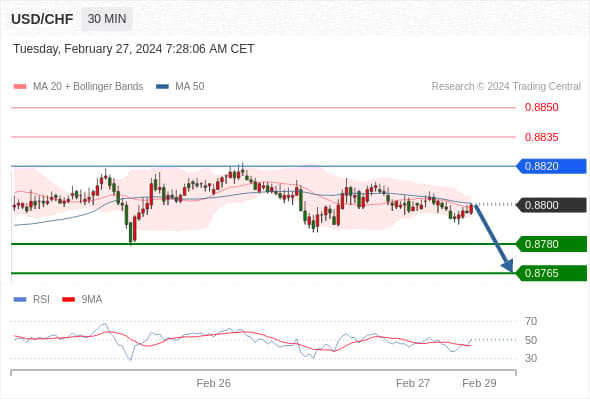
USD/CHF Today: Under pressure.
- Pivot Point:
0.8820
- Trading Strategy:
Below 0.8820, bearish, with target prices at 0.8780 and then 0.8765.
- Alternative Strategy:
Above 0.8820, bullish, with target prices set at 0.8835 and then 0.8850.
- Technical Commentary:
RSI technical indicator lacks upward momentum
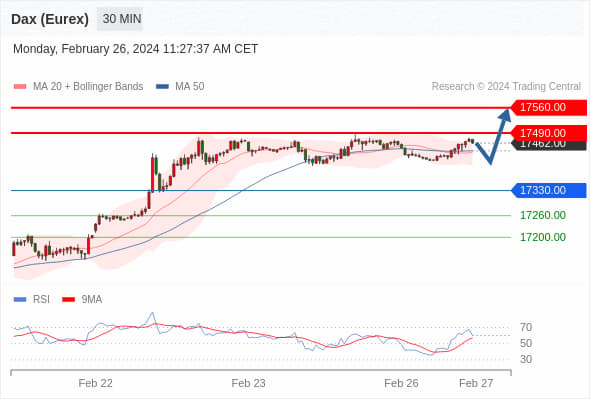
Germany DAX Index Futures (Eurex) (H4) Today: Bullish above 17330.00.
- Pivot Point:
17330.00
- Trading Strategy:
Above 17330.00, bullish, with target prices at 17490.00 and then 17560.00.
- Alternative Strategy:
Below 17330.00, bearish, with target prices set at 17260.00 and then 17200.00.
- Technical Commentary:
Even though we cannot rule out a continuation of the adjustment, its duration should be limited.
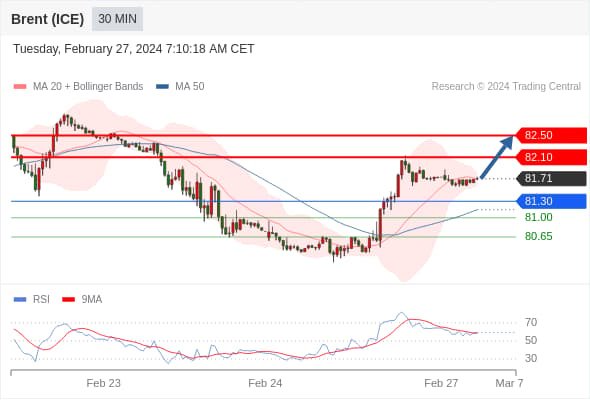
Brent Crude (ICE) (K4) Today: Bullish above 81.30.
- Pivot Point:
81.30
- Trading Strategy:
Above 81.30, bullish, with target prices at 82.10 and then 82.50.
- Alternative Strategy:
Below 81.30, bearish, with target prices set at 81.00 and then 80.65.
- Technical Commentary:
RSI technical indicator just reached the 50% neutral zone, reversing upwards.
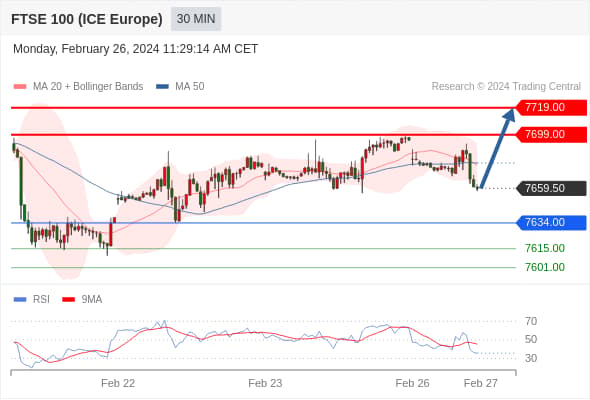
FTSE 100 Index Futures Today: No clear trend.
- Pivot Point:
7634.00
- Trading Strategy:
Above 7634.00, bullish, with target prices at 7699.00 and then 7719.00.
- Alternative Strategy:
Below 7634.00, bearish, with target prices set at 7615.00 and then 7601.00.
- Technical Commentary:
A support base around 7634.00 brings short-term stability to the trend.