View the market perspectives of the Global Research Department at the Trade Center today. Explore new trading methods and opportunities from popular trading products.
EUR/USD, GBP/USD, Spot Gold, EUR/JPY, EUR/GBP, USD/CHF, German DAX Index Futures (Eurex), Brent Crude (ICE), UK FTSE 100 Index Futures
Warm reminder: Due to market fluctuations, prices may have moved past key points, rendering strategies ineffective.
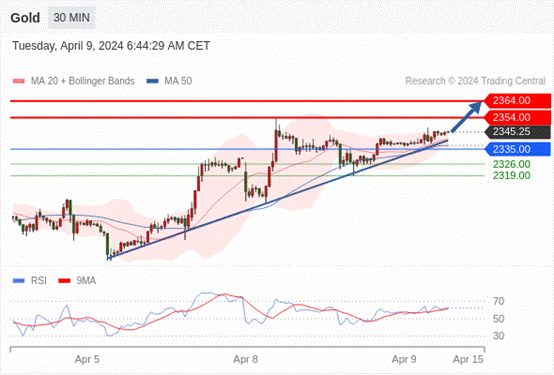
Spot Gold intra-day: Bullish trend.
Pivot point:
2335.00
Trading strategy:
Above 2335.00, bullish, with target prices at 2354.00, then 2364.00.
Alternative strategy:
Below 2335.00, bearish, with target prices at 2326.00, then 2319.00.
Technical commentary:
RSI indicator is bullish, with room for further upside.
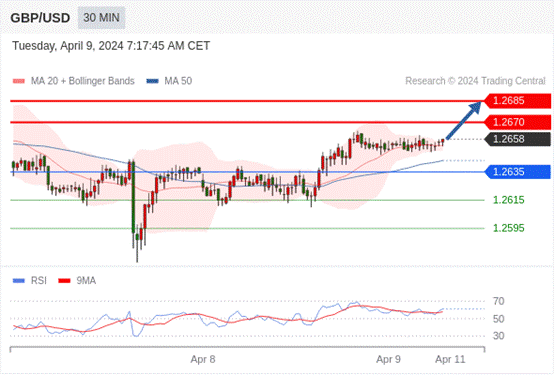
GBP/USD intra-day: Bullish.
Pivot point:
1.2635
Trading strategy:
Above 1.2635, bullish, with target prices at 1.2670, then 1.2685.
Alternative strategy:
Below 1.2635, bearish, with target prices at 1.2615, then 1.2595.
Technical commentary:
RSI indicator is trending upwards.
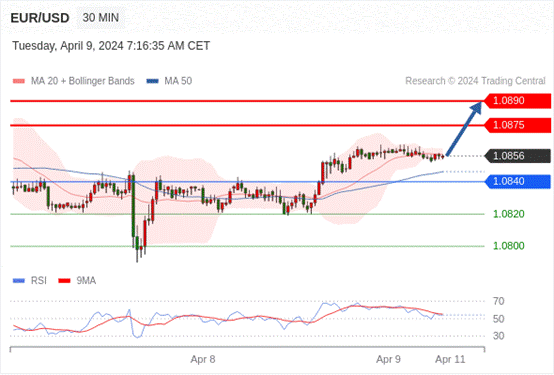
EUR/USD intra-day: Bullish above 1.0840.
Pivot point:
1.0840
Trading strategy:
Above 1.0840, bullish, with target prices at 1.0875, then 1.0890.
Alternative strategy:
Below 1.0840, bearish, with target prices at 1.0820, then 1.0800.
Technical commentary:
Even though we can't rule out the possibility of ongoing adjustments, they are expected to be short-lived.
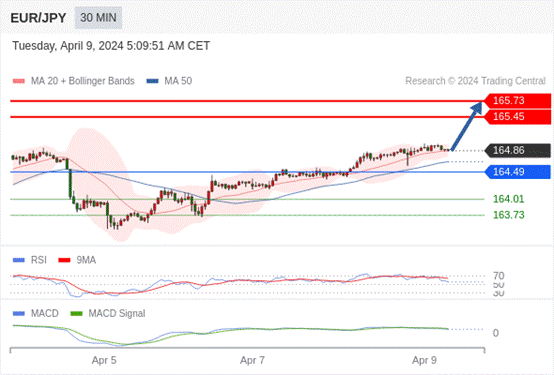
EUR/JPY intra-day: Bullish, with 164.49 as support, targeting 165.73.
164.49 as pivot point.
Trading strategy:
Bullish, with 164.49 as support, targeting 165.73.
Alternative strategy:
If falling below 164.49, EUR/JPY's target direction is set at 164.01 and 163.73.
Technical commentary:
RSI indicator is above the neutral zone of 50. MACD indicator is below its signal line, bullish. Additionally, the price is below its 20-day moving average (164.86) but above its 50-day moving average (164.67).
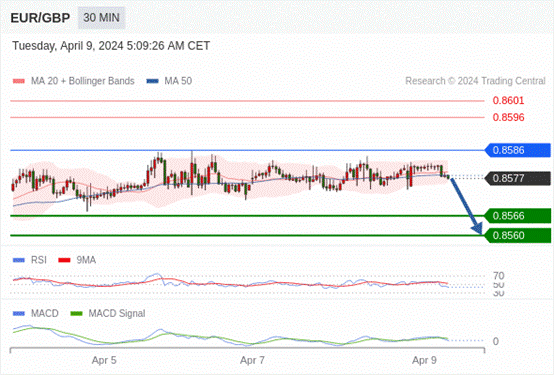
EUR/GBP intra-day: Bearish, with 0.8586 as resistance.
Pivot point:
0.8586
Trading strategy:
Bearish, when 0.8586 acts as resistance.
Alternative strategy:
If breaking through 0.8586, EUR/GBP's target direction is 0.8596 and 0.8601.
Technical commentary:
RSI indicator is below 50. MACD indicator is below its signal line, bullish. Moreover, the price is below its 20-day and 50-day moving averages (currently at 0.8579 and 0.8578).
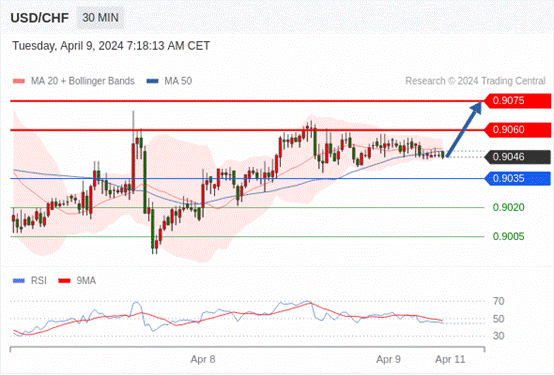
USD/CHF intra-day: Bullish above 0.9035.
Pivot point:
0.9035
Trading strategy:
Above 0.9035, bullish, with target prices at 0.9060, then 0.9075.
Alternative strategy:
Below 0.9035, bearish, with target prices at 0.9020, then 0.9005.
Technical commentary:
A support base has formed near 0.9035, bringing stability to the trend in the short term.
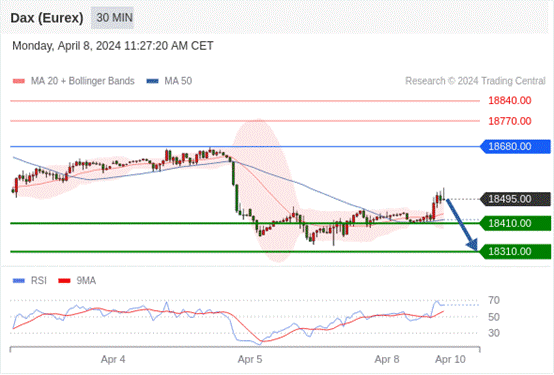
German DAX Index Futures (Eurex) intra-day: Short-term key resistance at 18680.00.
Pivot point:
18680.00
Trading strategy:
Below 18680.00, bearish, with target prices at 18410.00, then 18310.00.
Alternative strategy:
Above 18680.00, bullish, with target prices at 18770.00, then 18840.00.
Technical commentary:
As long as the resistance at 18680.00 persists, there's a bearish trend in price variability.
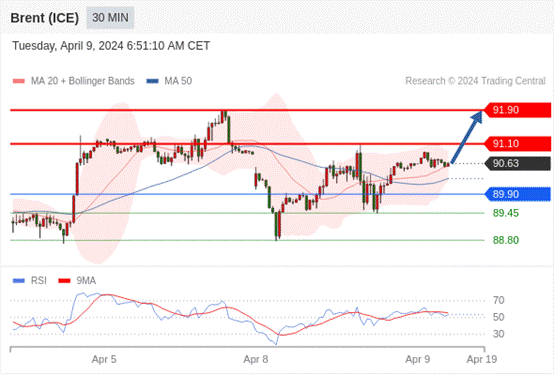
Brent Crude (ICE) intra-day: Bullish.
Pivot point:
89.90
Trading strategy:
Above 89.90, bullish, with target prices at 91.10, then 91.90.
Alternative strategy:
Below 89.90, bearish, with target prices at 89.45, then 88.80.
Technical commentary:
RSI indicator shows an upward trend.
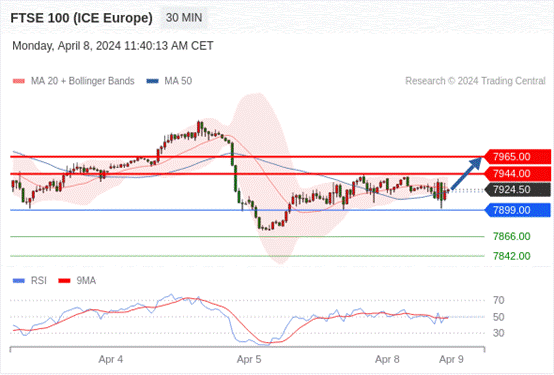
UK FTSE 100 Index Futures intra-day: Bullish above 7899.00.
Pivot point:
7899.00
Trading strategy:
Above 7899.00, bullish, with target prices at 7944.00, then 7965.00.
Alternative strategy:
Below 7899.00, bearish, with target prices at 7866.00, then 7842.00.
Technical commentary:
RSI indicator trends are complex, tending to rise.