What is a Head and Shoulders Bottom?
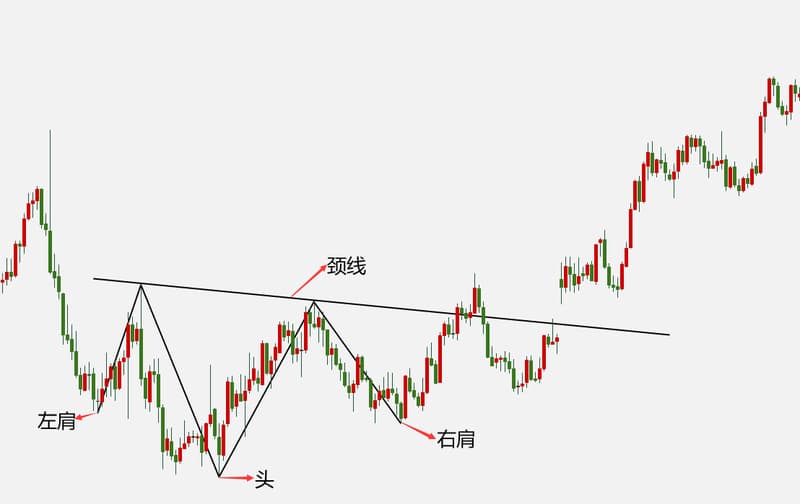
A head and shoulders bottom is a bullish pattern that appears towards the end of a downtrend and is formed by the left shoulder, bottom (head), right shoulder, and neckline. This pattern typically occurs during a downtrend in stocks or other assets, suggesting that prices are about to reverse and enter an uptrend.
The formation of a head and shoulders bottom takes time, usually spanning several months. Once the pattern is complete and the price breaks above the neckline, the head and shoulders bottom is considered valid and indicates that prices may rise further.
Characteristics of a Head and Shoulders Bottom
As a classic reversal pattern in technical analysis, the head and shoulders bottom has the following key characteristics:
- Reversal signal: The head and shoulders bottom appears in a downtrend, signaling a shift where selling pressure gradually weakens, and buying interest increases.
- Three low points: The head and shoulders bottom is formed by three low points, which include the left shoulder, head, and right shoulder. The lows of the left and right shoulders are usually relatively flat, while the head's low is more pronounced and lower than those of the shoulders.
- Volume changes: The head and shoulders bottom is generally accompanied by changes in trading volume, indicating shifts in market participant interest and activity.
- Neckline: The neckline of a head and shoulders bottom is the line connecting the rebound highs of the left shoulder and the head. A break above the neckline is considered a confirmation signal of the pattern.
- Target price: The price target can be estimated by measuring the height of the head and shoulders bottom, typically using the distance from the head's low to the neckline as the projected move once the neckline is broken.
Usage of a Head and Shoulders Bottom
The head and shoulders bottom is a common technical analysis pattern that can be used to predict trend reversals and potential price increases. Here are some typical uses in technical analysis:
- Trend reversal confirmation: The head and shoulders bottom usually appears in a downtrend. When the price breaks above the neckline, it is regarded as a confirmation signal of a trend reversal. Investors can use this pattern to confirm the end of the downtrend and predict the start of an uptrend.
- Buy signal: Once the price breaks above the neckline and the head and shoulders bottom pattern is confirmed, investors can establish long positions when the price retests the breakout point or during a pullback.
- Setting target prices: The target price can be estimated by using the height of the head and shoulders bottom pattern, which is typically the vertical distance from the head's low to the neckline breakout point.
- Stop loss setting: After the head and shoulders bottom pattern is confirmed, investors can set their stop-loss prices below the neckline to mitigate risks in case of a false breakout.
- Combining with other technical indicators: Investors can enhance the validity of the head and shoulders bottom pattern by incorporating other technical analysis tools and indicators, such as observing volume changes, price trend lines, and momentum indicators, to improve the accuracy of their trading decisions.