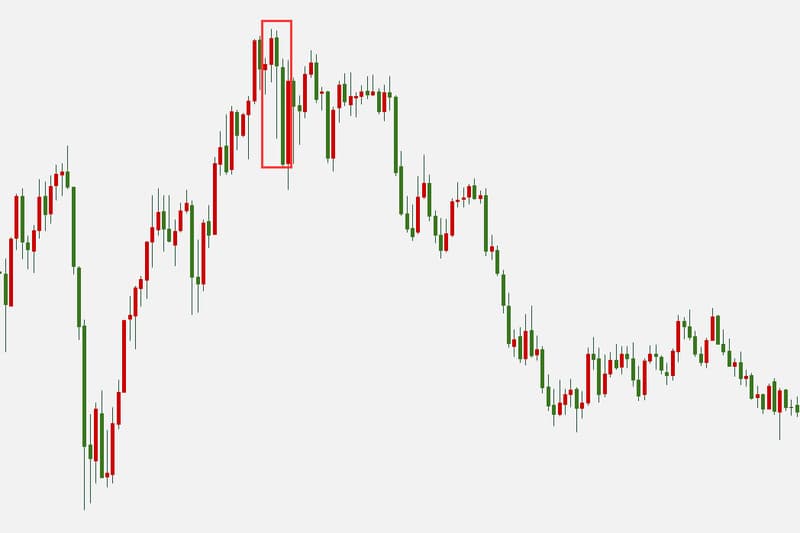
What is a Hanging Man?
The Hanging Man is a candlestick pattern that appears in an uptrend and indicates a potential reversal in market prices. Here are some features of the Hanging Man.
- Appears in an uptrend: The Hanging Man usually appears in an uptrend, indicating a weakening or end of the upward momentum.
- Small body and long lower shadow: The body of the Hanging Man is relatively small, usually white or green, representing an increase in selling pressure. The lower shadow is relatively long, at least twice the length of the body.
- Significant position: The Hanging Man is most effective after a continuous rise, suggesting fatigue in the upward momentum and a possible reversal.
- Requires confirmation: The Hanging Man alone cannot confirm a trend reversal; it needs to be followed by price action confirmation. The performance on the next trading day is crucial; if the price further declines, it might signal a trend reversal.
Usage of Hanging Man
As an auxiliary tool for judging trend reversals or turnarounds, the Hanging Man has several common uses.
- Trend reversal signal: When the Hanging Man appears in an uptrend, it can be seen as a potential trend reversal signal. If this pattern is confirmed by subsequent price declines, it may indicate the end of the uptrend and the beginning of a downtrend.
- Sell signal: The Hanging Man is regarded as a potential sell signal. When it appears in an uptrend, combined with other technical indicators and price patterns for confirmation, it can be used as a reference for selling.
- Confirmation of resistance or support levels: When the Hanging Man appears near price resistance or support levels, it can provide validation and confirmation of these levels. If it appears near a resistance level and subsequent prices drop, it can be seen as confirmation of the resistance level's validity.
- Trading decisions: The appearance of a Hanging Man can serve as a reference for trading decisions, such as sell points or closing signals. With the support of other technical indicators and market conditions, it can help in judging the appropriate timing for trades.
Difference Between Hanging Man and Hammer
The Hanging Man and Hammer are two candlestick patterns in Japanese candlestick charts, differing in shape and appearance. Here are their differences.
Hanging Man
- Appears in an uptrend, indicating a possible trend reversal.
- Has a small body and a long lower shadow.
- The small body is located at the upper end of the price range, signifying increased selling pressure.
- Best appears after a series of bullish candles, indicating upward momentum fatigue.
- If subsequent patterns confirm, such as further price decline, it may signal a trend reversal.
Hammer
- Appears in a downtrend, indicating a possible trend reversal.
- Has a small body and a long lower shadow.
- The small body is located at the lower end of the price range, signifying increased buying pressure.
- Best appears after a series of bearish candles, indicating downward momentum fatigue.
- If subsequent patterns confirm, such as further price rise, it may signal a trend reversal.
Although the Hanging Man and Hammer have some similarities in shape, their trend directions and the trend reversal they indicate are different. The Hanging Man appears in an uptrend, while the Hammer appears in a downtrend.